Hermosa Beach Takes Neighborhood Watch Very Seriously
One of the local Hermosa Beach residents on neighborhood watch patrol!

One of the local Hermosa Beach residents on neighborhood watch patrol!
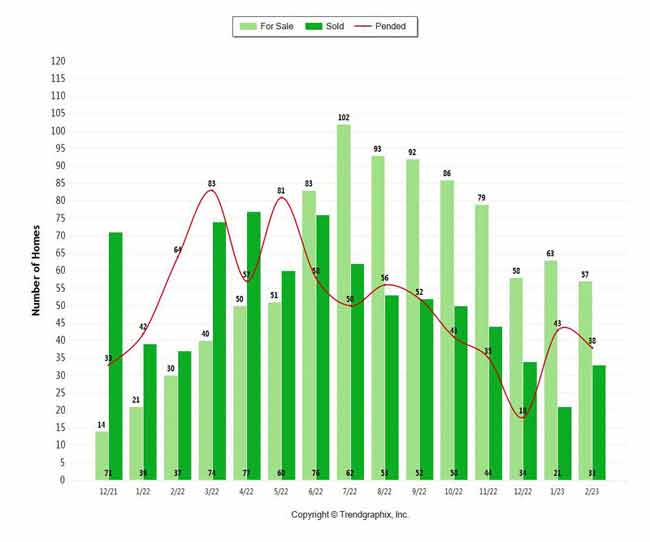
Distressed home sales and listings continues to go down with both REO and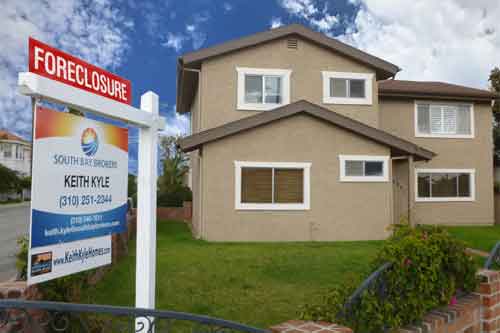 short sale opportunities fading. The number of short sales and bank owned homes in Manhattan Beach, Redondo Beach, and Hermosa Beach have always been relatively low compared with other, more inland, areas and communities, but it appears that the inventory of these homes is at a several year low and looks to remain that way. The days of finding a “deal” in these cities may be a thing of the past. Redondo Beach, due to both the size of the city and the entry level price point options, has far and away the greatest concentration of distressed sales between the 3 cities but numbers decline there as well.
The chart below shows the most recent number of active, pending and sold short sales in Redondo, Hermosa, and Manhattan Beach.
Keep informed on the price of Redondo Beach homes and know what direction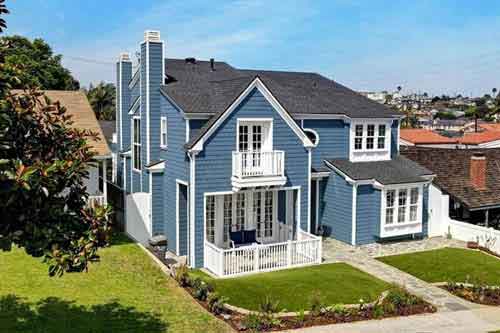 the real estate market is heading. See below for the median price of South Bay Homes in October and see the change in average home price from 2011. Average home prices based on one month of information can vary quite a bit based on a number of factors but the information can show an overall housing market trend in Redondo Beach.
| City | Homes Sold | October2012 Median | October2011 Median | Yearover Year % Change |
| Carson | 56 | $286,500 | $300,000 | -4.50% |
| El Segundo | 11 | $648,000 | $348,500 | 85.94% |
| Gardena | 58 | $299,250 | $260,000 | 15.10% |
| Harbor City | 14 | $337,500 | $300,000 | 12.50% |
| Hawthorne | 51 | $360,000 | $328,500 | 9.59% |
| Hermosa Beach | 15 | $835,000 | $1,000,000 | -16.50% |
| Lawndale | 10 | $252,500 | $315,000 | -19.84% |
| Lomita | 13 | $450,000 | $392,500 | 14.65% |
| Long Beach | 341 | $302,750 | $282,000 | 7.36% |
| Manhattan Beach | 36 | $1,137,500 | $1,222,500 | -6.95% |
| Marina Del Rey | 36 | $652,500 | $590,000 | 10.59% |
| Palos Verdes Estates | 31 | $1,282,500 | $1,000,000 | 28.25% |
| Playa Del Rey | 16 | $344,750 | $335,000 | 2.91% |
| Rancho Palos Verdes | 45 | $870,000 | $922,000 | -5.64% |
| Redondo Beach | 97 | $700,000 | $623,750 | 12.22% |
| San Pedro | 55 | $330,500 | $345,750 | -4.41% |
| Torrance | 121 | $467,000 | $447,500 | 4.36% |
| Westchester | 43 | $627,000 | $561,750 | 11.62% |
The surf, the sun, the sand, the beautiful views…..the luxury home market in the Manhattan Beach sand section has remained strong although there has been a slow down of pending home sales since the end of summer. Currently there are 14 active homes and townhomes for sale in the sand section priced over $2,000,000. The average price for active listings in the sand section is $3,595,000 with the average sales price of $2,422,600 for homes sold since October 1, 2012.
Currently there are more homes for sale priced above $2.0M than below with 14 homes priced above and only 13 homes sub $2.0M. Much of the driving force of the high current list average is due to the number of oceanfront homes on The Strand as well as a number of luxury walkstreet homes.
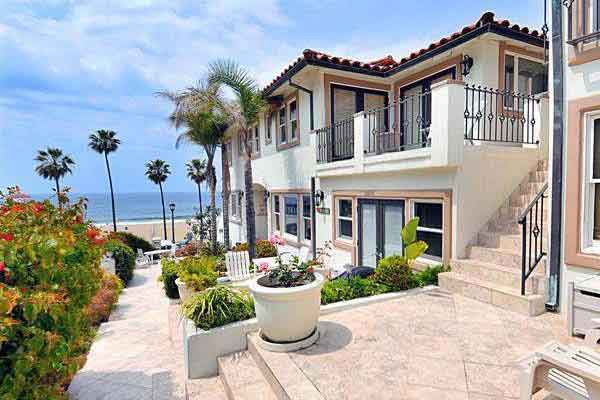
If you’re looking for endless ocean views with a coastal inspired home in the South Bay, the home at 807 Esplanade may just fit the bill. From the moment you walk in the home you are struck with incredible ocean views.
[idx-listing mlsnumber=”SB12142776″ showall=”true”]
As most of the local Manhattan Beach real estate market and surrounding cities seem to be suffering from a lack of inventory, the number of active homes for sale in Manhattan Village, the gated community in Manhattan Beach CA, has increased in the past few weeks with 5 current court homes and townhomes for sale.