
North Redondo Beach Real Estate Trends
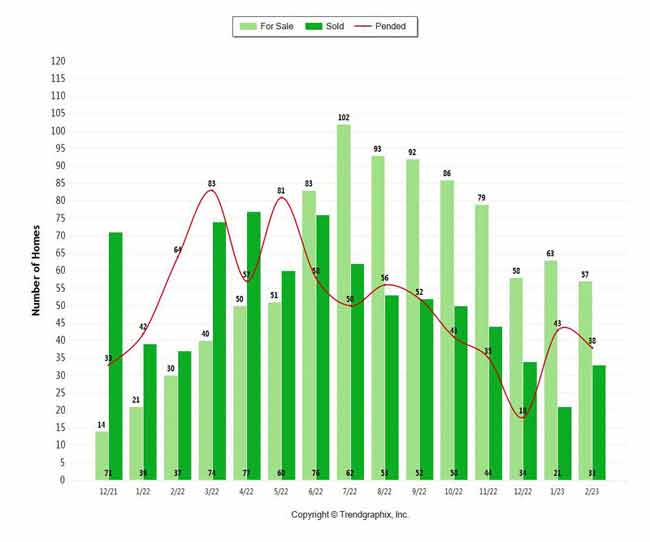
Information is critical when considering buying or selling a home and we hope that the information below will provide some insight into what is happening in the Redondo Beach real estate market. Our first chart below shows the level of homes for sale as well as pending home sales and closed home sales by month for the past 12 months.
Homes currently active on the market are represented by the light green bar, pending home sales represented by the teal bars and sold/closed listings are represented by the red line.
The above chart represents the current months of unsold inventory based on the number of closed sales
The above chart tracks current list prices in relation to current sales prices. As the lines get closer together it is a strong indication that we are moving into a sellers market.