
Manhattan Beach Sand Section Market Update
Manhattan Beach Sand Section Homes Report
The sand section of Manhattan Beach offers the epitome of California coastal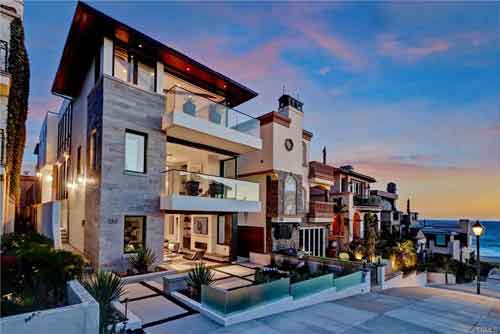 living. The sand section is the area of Manhattan Beach that is bordered by the beach and ocean to the west, and generally the streets of Valley and Ardmore to the east. What makes this area so desirable is the proximity to the beach and the ocean. The area offers a variety of housing options with oceanfront luxury homes on The Strand, beautiful “walk street” homes with a wonderful sense of community and often sweeping ocean views, townhomes just a few blocks to the beach, and multi unit homes of North Manhattan, known as El Porto. The market is always very active as the demand is always strong for prime beach real estate. As of mid March there are 9 active homes for sale in the Manhattan Beach sand section, 21 pending home sales and 18 closed homes sales as of February 1st. According to Manhattan Beach realtor Keith Kyle, “Incredibly low inventory coupled with very high demand since the beginning of the year is driving prices up quickly. There are many buyers looking in this luxury market, but there are very few listings and even homes priced at market value are often selling with multiple offers, over asking and with huge concessions by the buyers.” The current average sales price since the beginning of February has been slightly over $2,300,000. See the chart below to see the market by the numbers.
| Active MLS Listings – Currently there are 9 active homes for sale in the Manhattan Beach Sand Section | |||||||||
| List Price | ADOM | BR | BA | Year Built | SqFt | Lot SqFt | |||
| Min | 1,179,000 | 2 | – | 2 | 2.00 | 1933 | 1,392 | 1,153 | |
| Max | 6,750,000 | 19 | – | 5 | 6.00 | 2013 | 5,000 | 3,772 | |
| Avg | 3,207,889 | 10 | – | 4 | 4.00 | 1990 | 3,012 | 2,216 | |
| Sum | 28,871,000 | – | |||||||
| 8 Pending home Sales – 21 Total “In Escrow” | |||||||||
| List Price | ADOM | BR | BA | Year Built | SqFt | Lot SqFt | |||
| Min | 975,000 | – | 2 | 2.00 | 1946 | 1,082 | 1,350 | ||
| Max | 2,499,000 | 105 | – | 5 | 4.00 | 2009 | 2,989 | 5,885 | |
| Avg | 1,854,750 | 31 | – | 3 | 3.38 | 1982 | 2,040 | 2,855 | |
| 13 Pending Sales in Backup Offer Status | |||||||||
| List Price | ADOM | BR | BA | Year Built | SqFt | Lot SqFt | |||
| Min | 925,000 | 5 | – | 2 | 1.00 | 1921 | 982 | 1,345 | |
| Max | 6,995,000 | 73 | – | 5 | 5.00 | 2007 | 5,000 | 4,930 | |
| Avg | 2,519,538 | 36 | – | 4 | 3.69 | 1988 | 2,602 | 2,577 | |
| 18 Closed Home Sales since 2/1/2013 | |||||||||
| List Price | ADOM | Selling Price | BR | BA | Year Built | SqFt | Lot SqFt | ||
| Min | 1,199,000 | 1,214,500 | 2 | 2.00 | 1927 | 1,350 | 990 | ||
| Max | 11,500,000 | 449 | 10,995,000 | 5 | 5.00 | 2012 | 4,761 | 3,507 | |
| Avg | 2,409,278 | 78 | 2,362,350 | 3 | 3.72 | 1987 | 2,281 | 2,562 | |
| Sum | 43,367,000 | 42,522,300 | |||||||
| Status: All (48) | |||||||||
| List Price | ADOM | Selling Price | BR | BA | Year Built | SqFt | Lot SqFt | ||
| Min | 925,000 | 1,214,500 | 2 | 1.00 | 1921 | 982 | 990 | ||
| Max | 11,500,000 | 449 | 10,995,000 | 5 | 6.00 | 2013 | 5,000 | 5,885 | |
| Avg | 2,496,458 | 46 | 2,362,350 | 3 | 3.71 | 1987 | 2,465 | 2,549 | |

 Realtors and why, If done with the right motives, it’s so rewarding. In the stresses of an escrow, or in the challenges of a day of showing houses, it’s easy to lose sight of what selling a home can mean and for many it’s just another “deal”. But that’s not at all what this is about. I work with many first time home buyers and it is no exaggeration to think that this decision that I’m helping them make is nothing short of life altering. The home someone chooses is more than just granite counters, 2.5 bathrooms, corner lot, fixer or turn key….it is choosing a neighborhood, choosing neighbors, choosing schools, and even choosing a lifestyle. It’s about people…the people the home buyer doesn’t even know yet that may end up being friends for life.