By Keith Kyle
When most buyers come to me they know that they’re interested in Redondo Beach, but don’t know much about the various parts and the differences in the neighborhoods. While there are a number of different neighborhoods and real estate “areas” the big distinction is between North Redondo and South Redondo.
So what’s the difference?
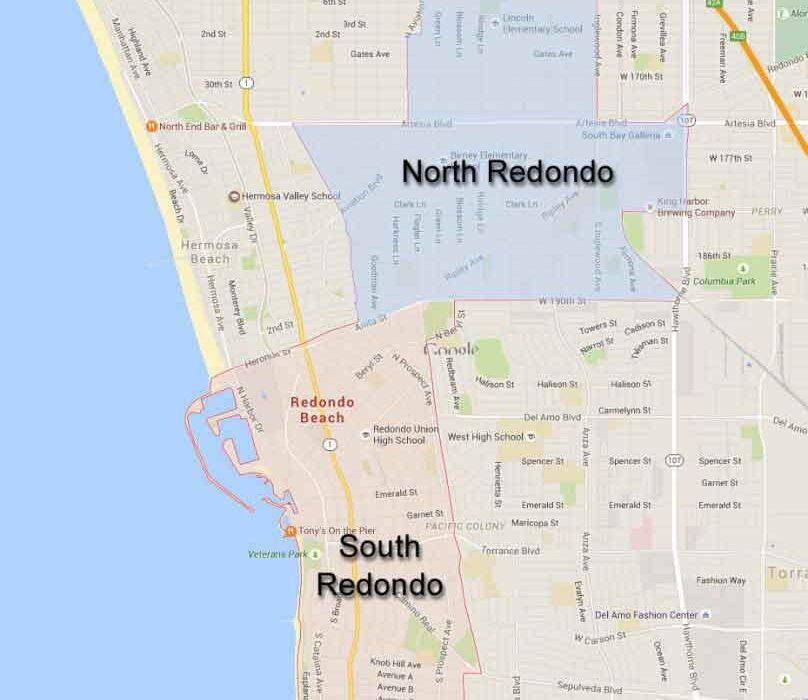
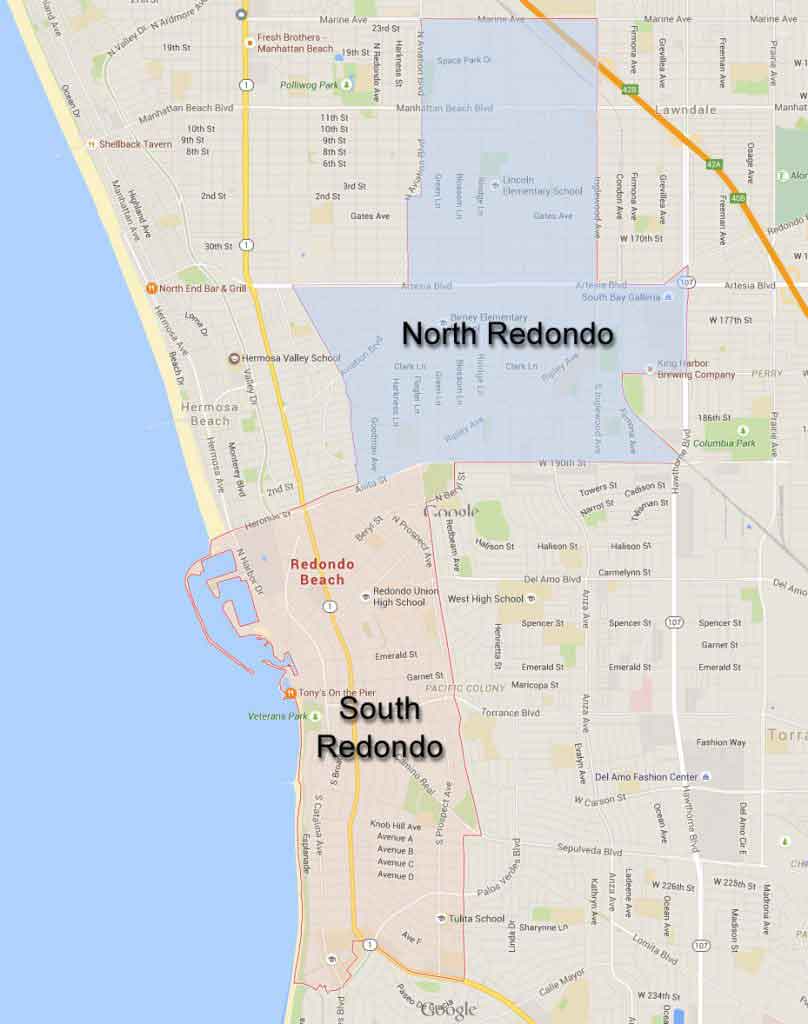
The physical dividing line between the two is 190th Street and Anita, but in reality the differences are much more than just the separation of the street. The “feel” of North Redondo and South Redondo are the most significant difference. North Redondo sits east of Manhattan Beach and Hermosa Beach with no beach to call it’s own, while South Redondo has the prototypical “beach” feel and incorporates the areas of King Harbor, Redondo Beach, the Redondo pier and the beachfront street of the Esplanade.
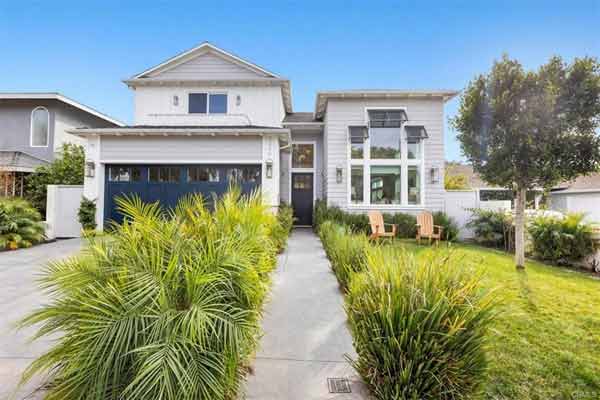
 Both north Redondo and South Redondo have a variety of housing options ranging from condos to mansions and everything in between, but when people often think of “Redondo Beach” they think of oceanfront and oceanview homes and those are only found in South Redondo.
The tradeoff is home prices and values. In general, homes in South Redondo are more expensive and more valuable than similar homes in North Redondo, and it’s really all about the proximity to the beach, and the “beach” feel. While condos are a bit rarer in North Redondo, home prices generally start in the mid $500,000 for a smaller condo or townhome up to well over $1,500,000 for a larger home on a larger lot. Home values can start in the mid $300,000 for a condo in Brookside Village and can reach to over $10,000,000 (which is very rare) for one of the few oceanfront estate style homes on the Esplanade.