Redondo Beach Home Sales and Home Prices in October
October 2017 Real Estate Market in Redondo Beach
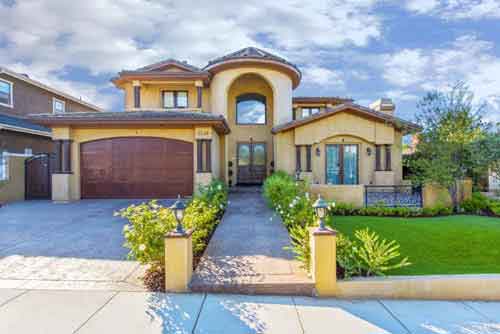
The coastal community of Redondo Beach CA saw big home sales numbers for October of 2017. Median home prices topped $1,100,000 with 72 homes and properties sold. The median prices were over 25% higher than October of the previous year in which the median price was just under $880,000. Visit our recent home sales section to see the homes that sold in Redondo Beach for October and other months. See also the current homes for sale in Redondo Beach, CA.
| City | Homes Sold | October 2017 Median | October 2016 Median | Year over Year % Change% |
| Carson | 58 | $495,000 | $455,000 | 8.8% |
| El Segundo homes | 19 | $875,000 | $925,000 | -5.4% |
| Gardena | 43 | $545,000 | $490,000 | 11.2% |
| Harbor City | 17 | $510,000 | $4145,000 | 23% |
| Hawthorne real estate | 50 | $578,000 | $540,000 | 6.9% |
| Hermosa Beach homes | 21 | $1,414,000 | $2,038,000 | -30.6% |
| Lawndale | 21 | $505,000 | $411,000 | 23% |
| Lomita | 17 | $575,000 | $580,000 | -.9% |
| Long Beach | 322 | $525,000 | $475,000 | 10.5% |
| Manhattan Beach homes | 28 | $2,875,000 | $2,250,000 | 27.8% |
| Marina Del Rey | 25 | $979,000 | $1,150,000 | 14.9% |
| Palos Verdes Estates | 30 | $1,600,000 | $1,825,000 | -12.3% |
| Play Del Rey | 16 | $665,000 | $635,000 | 4.8% |
| Rancho Palos Verdes | 47 | $1,265,000 | $1,250,000 | 1.2% |
| Redondo Beach | 72 | $1,105,000 | $878,000 | 25.8% |
| San Pedro | 69 | $530,000 | $588,000 | -9.8% |
| Torrance real estate | 127 | $675,000 | $632,000 | 6.9% |
| Westchester | 38 | $1,089,000 | $1,050,000 | 3.7% |