Hermosa Beach Takes Neighborhood Watch Very Seriously
One of the local Hermosa Beach residents on neighborhood watch patrol!

Real estate and homes for sale in Hermosa Beach
One of the local Hermosa Beach residents on neighborhood watch patrol!
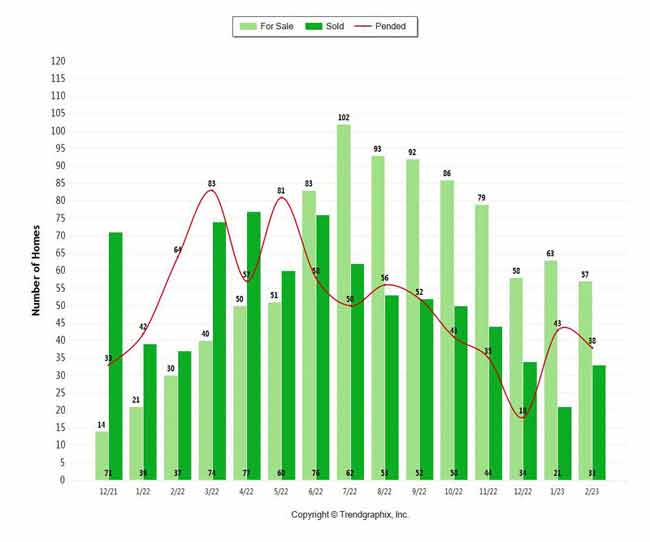
Distressed home sales and listings continues to go down with both REO and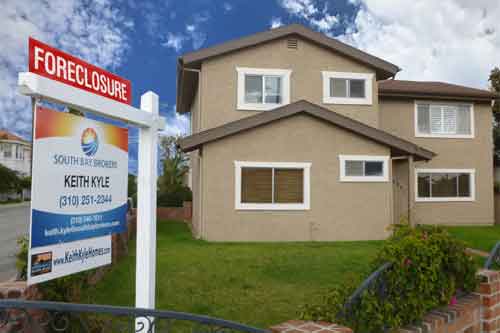 short sale opportunities fading. The number of short sales and bank owned homes in Manhattan Beach, Redondo Beach, and Hermosa Beach have always been relatively low compared with other, more inland, areas and communities, but it appears that the inventory of these homes is at a several year low and looks to remain that way. The days of finding a “deal” in these cities may be a thing of the past. Redondo Beach, due to both the size of the city and the entry level price point options, has far and away the greatest concentration of distressed sales between the 3 cities but numbers decline there as well.
The chart below shows the most recent number of active, pending and sold short sales in Redondo, Hermosa, and Manhattan Beach.
Keep informed on the price of Redondo Beach homes and know what direction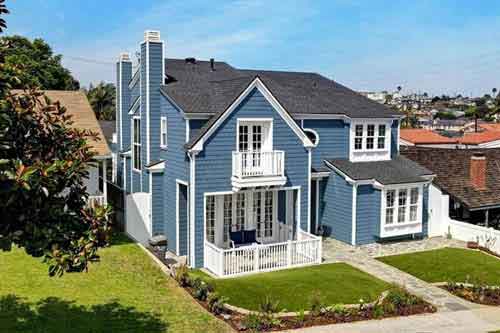 the real estate market is heading. See below for the median price of South Bay Homes in October and see the change in average home price from 2011. Average home prices based on one month of information can vary quite a bit based on a number of factors but the information can show an overall housing market trend in Redondo Beach.
| City | Homes Sold | October2012 Median | October2011 Median | Yearover Year % Change |
| Carson | 56 | $286,500 | $300,000 | -4.50% |
| El Segundo | 11 | $648,000 | $348,500 | 85.94% |
| Gardena | 58 | $299,250 | $260,000 | 15.10% |
| Harbor City | 14 | $337,500 | $300,000 | 12.50% |
| Hawthorne | 51 | $360,000 | $328,500 | 9.59% |
| Hermosa Beach | 15 | $835,000 | $1,000,000 | -16.50% |
| Lawndale | 10 | $252,500 | $315,000 | -19.84% |
| Lomita | 13 | $450,000 | $392,500 | 14.65% |
| Long Beach | 341 | $302,750 | $282,000 | 7.36% |
| Manhattan Beach | 36 | $1,137,500 | $1,222,500 | -6.95% |
| Marina Del Rey | 36 | $652,500 | $590,000 | 10.59% |
| Palos Verdes Estates | 31 | $1,282,500 | $1,000,000 | 28.25% |
| Playa Del Rey | 16 | $344,750 | $335,000 | 2.91% |
| Rancho Palos Verdes | 45 | $870,000 | $922,000 | -5.64% |
| Redondo Beach | 97 | $700,000 | $623,750 | 12.22% |
| San Pedro | 55 | $330,500 | $345,750 | -4.41% |
| Torrance | 121 | $467,000 | $447,500 | 4.36% |
| Westchester | 43 | $627,000 | $561,750 | 11.62% |
Something relatively unique to Manhattan Beach real estate and Hermosa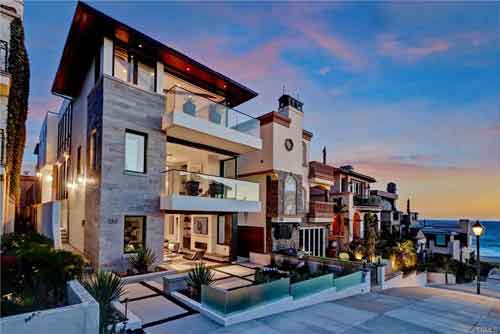 Beachare the homes located on “walk streets”. These walkstreet locations offer the absolute ideal in community beach living as they are located on lots that have parking and garage at the back of the home and the front of the home sits on a pedestrian only sidewalk. According to Keith Kyle, a top realtor with Vista Sotheby’s International, “These walkstreets offer a sense of community that is a bit different than other areas. As the front yards and patios all face the sidewalk the walkstreet often becomes the center of the community for these streets. They are very family friendly as there isn’t the risk that busy streets and cars create so it has a very safe feeling. As they are almost always located within a block or two of The Strand and the beach it has that old school beach community feel”.
Walkstreets are very limited and are only in the sand sections of both Hermosa and Manhattan Beach. They range in size due to the contours of the streets they cross but all create a very community and family friendly environment and are some of the most sought after locations in the South Bay. Prices in Manhattan Beach generally start around $3.0M (usually on a corner of a walkstreet and moderately busy street) andquickly go up from there and prices are now reaching into the high $5.0M range for homes with big views and closest to the beach. Homes in Hermosa Beach start in the mid $1M range (some homes have unusual situations such as no garage, small lot, etc) to the new high water market of $5.25M for the home mentioned above at 41 16th Street. In Hermosa Beach the streets are generally flat so views are not something overly common, but that’s not the case in Manhattan Beach where the slope of the hill often means just about every home enjoys some nice ocean views.
Click here to view the current homes for sale in the Sand Section of Manhattan Beach or visit our Hermosa Beach Sand Section listings page.
Located at 41 16th Street in the Hermosa Beach sand section, this new listing from South Bay Brokers is a home that has it all. Located just feet from the sand, the home sits on one of Hermosa Beach’s great walkstreet locations.
[idx-listing mlsnumber=”SB12141434″ showall=”true”]
Year over year median home prices increased in most South Bay cities for September 2012. 12 of the 18 cities we track saw increases in median prices from September of the previous year. Manhattan Beach real estate along with Hermosa and Torrance saw double digit increases while Redondo Beach had an increase in home values of only 1%.
Click here to view the sold homes listed per South Bay city for the month of September. To see charts and information on real estate trends visit our market trends section.
| City | Homes Sold |
September 2012 Median |
September 2011 Median |
Year over Year % Change |
| Carson | 54 | $270,000 | $277,500 | -2.70% |
| El Segundo | 16 | $595,750 | $550,000 | 8.32% |
| Gardena | 44 | $310,000 | $279,000 | 11.11% |
| Harbor City | 19 | $215,000 | $238,000 | -9.66% |
| Hawthorne | 40 | $383,500 | $327,500 | 17.10% |
| Hermosa Beach | 23 | $1,037,500 | $905,000 | 14.64% |
| Lawndale | 15 | $241,000 | $285,000 | -15.44% |
| Lomita | 13 | $410,000 | $407,000 | 0.74% |
| Long Beach | 286 | $295,000 | $285,500 | 3.33% |
| Manhattan Beach | 29 | $1,300,000 | $1,125,000 | 15.56% |
| Marina Del Rey | 30 | $706,000 | $611,250 | 15.50% |
| Palos Verdes Estates | 31 | $1,085,500 | $1,100,000 | -1.32% |
| Playa Del Rey | 14 | $405,000 | $522,500 | -22.49% |
| Rancho Palos Verdes | 47 | $950,000 | $893,000 | 6.38% |
| Redondo Beach | 73 | $659,000 | $652,500 | 1.00% |
| San Pedro | 44 | $372,500 | $310,000 | 20.16% |
| Torrance | 123 | $462,000 | $403,000 | 14.64% |
| Westchester | 39 | $625,000 | $659,000 | -5.16% |