
Category: Manhattan Beach
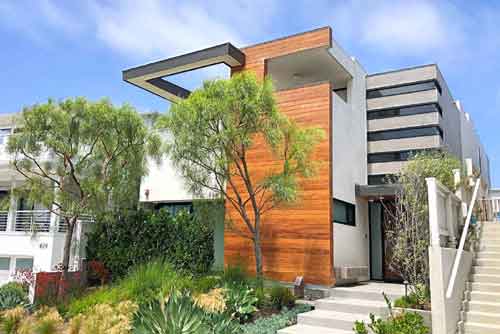
Hermosa and Manhattan Beach Luxury Walkstreet Homes Driving the Market
Hemosa Beach and Manhattan Beach Walkstreet Homes
Prices have jumped considerably in the sand sections of both Hermosa Beach and Manhattan Beach, and much of the reason is the recent flood of the market of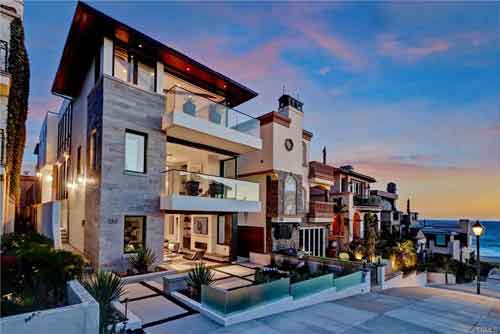 very high end luxury homes in A+ locations. Although there are a few oceanfront “Strand” homes for sale, the primary reason for the recent rise in median prices is the number of homes and townhomes on the highly sought after “walkstreet” locations. The current median price for a Hermosa walkstreet home is $3974,000 and the current average price is $4,447,500. The current median price for a Manhattan Beach walkstreet home is $3,350,000 and the average price is $4,123,000.
For more information on the Manhattan Beach or Hermosa Beach sand section, or any of these luxury walkstreet properties, please feel free to contact us at 310-251-2344 or keith@keithkylehomes.com.
Real Estate in the Manhattan Beach Tree Section a Hot Market
Homes in the Manhattan Beach “tree section” are always a hot commodity and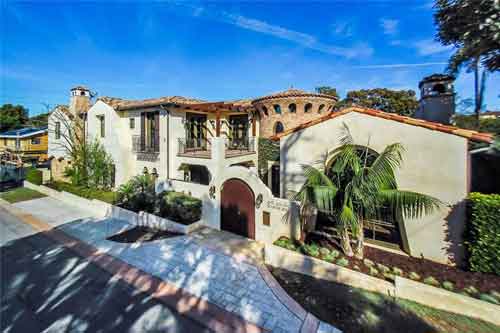 the market never took too much of a hit during the market slow down of the past few years. Due in part to great schools, family friendly neighborhoods, proximity to the beach, and limited supply, tree section luxury homes and Manhattan Beach real estate in general, has always remainded strong. The market has really taken off since the beginning of the year with most home listings getting multiple offers and often selling above list price.
Current Manhattan Beach Tree Section Homes for Sale
So What’s All The Hype about “Off Market” Redondo Beach Listings These Days?
With the local real estate market so active, home inventory at near record lows and buyers in a frenzy to find homes, the buzz is all about “off market” listings. So what does that really mean and how can it benefit you? Off market listings can mean a number of different things which can include:
- Exclusive listings – This is a situation in which a realtor has a signed listing agreement but the seller doesn’t want it on the MLS for some reason. This can sometimes be due to the home having tenants, can be due to sellers simply not wanting to go through the hassles of open houses, endless showings, etc. This usually will get the seller a lower sales price, but for many it’s well worth it. It’s great for home buyers to know about these listings as the competition can be far less fierce. Less competition can often mean better price and terms for the buyer
- Upcoming listings – sometimes a home will be coming up for sale but just not listed yet. The usual reason is that the seller is getting it ready for the market. This can mean anything from doing major work/upgrading to simply cleaning it up. If you can get in early before the seller has spent money there is an opportunity to buy at a lower price.
- Pocket listings – this is a situation in which someone (usually a realtor) knows of someone that “might” consider selling. As they usually do not have a listing agreement signed it’s tough to get much information from them. Agents often contact me with pocket listings and may give a street or a vague description but often not an actual address.
There are other opportunities as well with some sellers taking a “make me move” type approach in which the right price just may get them to consider selling. Other potential opportunities may include knowing which homes have a notice of default or notice of trustee’s sale, and they may consider doing a short sale (although most lenders require the home to be “on the market” for them to consider)
So how do you find out about off market listings? The best way is to find a local realtor that spends time networking with other agents and homeowners. Intimate market knowledge is critical as many top agents share listing information prior to it going on the MLS or being marketed to the masses. I generally hear of 10 listings or so each week that are off market or not yet listed and this can be a tremendous advantage in a market that is so competitive. Contact South Bay realtor Keith Kyle for information on off market listings and homes not yet on the MLS.
North Manhattan – El Porto Real Estate
Welcome to El Porto in North Manhattan Beach
The most affordable area of the Manhattan Beach sand section
While the real estate market around the country was taking a hit, home values along the coast of the South Bay remained as stable as ever. The “sand” section of Manhattan Beach remained particularly strong as oceanview and oceanfront homes that are walkable to the beach are always in demand. Home prices in the sand section (see map) are reaching unbelievable highs with full lot walkstreets in the 3-6 million dollar range, depending on age, condition and view.
While these homes are out of reach for most South Bay buyers, there is an area of Manhattan Beach that offers far more reasonable home prices. The area is known as “north” Manhattan, although it’s more familiar to most as El Porto. El Porto is the northernmost neighborhood of Manhattan Beach. Ideally located for commuters traveling to Santa Monica or downtown Los Angeles, El Porto offers close proximity to LAX, Marina Del Rey, the Westside and more. As El Porto lies on a fairly steep grade, homes in the area often offer stunning ocean and panoramic views from Palos Verdes to Malibu. One unique feature of El Porto is that it offes many half lots generally measuring 45×30 which allows for some more affordable housing within a block or two from the ocean. Many of these homes are “legal non-conforming” duplexes with a 2 bedroom unit upstairs and a 1 bedroom or studio rental downstairs. Homes in the area start in the mid $1,500,000 and depending on size, age, and views can go up to the $3,500,000+ range. The area is ideal for people not needing a huge home, that love the beach and ocean, and want to shave off 15 minutes of their commute. For surfing enthusiasts, it happens to front the best surfing beach in the South Bay. If you are looking for an oceanview home in Manhattan Beach you may want to consider the El Porto.
Keith Kyle – Realtor, e-Pro – Vista Sotheby’s International– 2501 N Sepulveda Blvd Manhattan Beach, CA 90266 – 310-251-2344
Manhattan Beach Sand Section Market Update
Manhattan Beach Sand Section Homes Report
The sand section of Manhattan Beach offers the epitome of California coastal living. The sand section is the area of Manhattan Beach that is bordered by the beach and ocean to the west, and generally the streets of Valley and Ardmore to the east. What makes this area so desirable is the proximity to the beach and the ocean. The area offers a variety of housing options with oceanfront luxury homes on The Strand, beautiful “walk street” homes with a wonderful sense of community and often sweeping ocean views, townhomes just a few blocks to the beach, and multi unit homes of North Manhattan, known as El Porto. The market is always very active as the demand is always strong for prime beach real estate. As of mid March there are 9 active homes for sale in the Manhattan Beach sand section, 21 pending home sales and 18 closed homes sales as of February 1st. According to Manhattan Beach realtor Keith Kyle, “Incredibly low inventory coupled with very high demand since the beginning of the year is driving prices up quickly. There are many buyers looking in this luxury market, but there are very few listings and even homes priced at market value are often selling with multiple offers, over asking and with huge concessions by the buyers.” The current average sales price since the beginning of February has been slightly over $2,300,000. See the chart below to see the market by the numbers.
| Active MLS Listings – Currently there are 9 active homes for sale in the Manhattan Beach Sand Section | |||||||||
| List Price | ADOM | BR | BA | Year Built | SqFt | Lot SqFt | |||
| Min | 1,179,000 | 2 | – | 2 | 2.00 | 1933 | 1,392 | 1,153 | |
| Max | 6,750,000 | 19 | – | 5 | 6.00 | 2013 | 5,000 | 3,772 | |
| Avg | 3,207,889 | 10 | – | 4 | 4.00 | 1990 | 3,012 | 2,216 | |
| Sum | 28,871,000 | – | |||||||
| 8 Pending home Sales – 21 Total “In Escrow” | |||||||||
| List Price | ADOM | BR | BA | Year Built | SqFt | Lot SqFt | |||
| Min | 975,000 | – | 2 | 2.00 | 1946 | 1,082 | 1,350 | ||
| Max | 2,499,000 | 105 | – | 5 | 4.00 | 2009 | 2,989 | 5,885 | |
| Avg | 1,854,750 | 31 | – | 3 | 3.38 | 1982 | 2,040 | 2,855 | |
| 13 Pending Sales in Backup Offer Status | |||||||||
| List Price | ADOM | BR | BA | Year Built | SqFt | Lot SqFt | |||
| Min | 925,000 | 5 | – | 2 | 1.00 | 1921 | 982 | 1,345 | |
| Max | 6,995,000 | 73 | – | 5 | 5.00 | 2007 | 5,000 | 4,930 | |
| Avg | 2,519,538 | 36 | – | 4 | 3.69 | 1988 | 2,602 | 2,577 | |
| 18 Closed Home Sales since 2/1/2013 | |||||||||
| List Price | ADOM | Selling Price | BR | BA | Year Built | SqFt | Lot SqFt | ||
| Min | 1,199,000 | 1,214,500 | 2 | 2.00 | 1927 | 1,350 | 990 | ||
| Max | 11,500,000 | 449 | 10,995,000 | 5 | 5.00 | 2012 | 4,761 | 3,507 | |
| Avg | 2,409,278 | 78 | 2,362,350 | 3 | 3.72 | 1987 | 2,281 | 2,562 | |
| Sum | 43,367,000 | 42,522,300 | |||||||
| Status: All (48) | |||||||||
| List Price | ADOM | Selling Price | BR | BA | Year Built | SqFt | Lot SqFt | ||
| Min | 925,000 | 1,214,500 | 2 | 1.00 | 1921 | 982 | 990 | ||
| Max | 11,500,000 | 449 | 10,995,000 | 5 | 6.00 | 2013 | 5,000 | 5,885 | |
| Avg | 2,496,458 | 46 | 2,362,350 | 3 | 3.71 | 1987 | 2,465 | 2,549 | |