See the 82 Homes that Sold in Redondo Beach in August
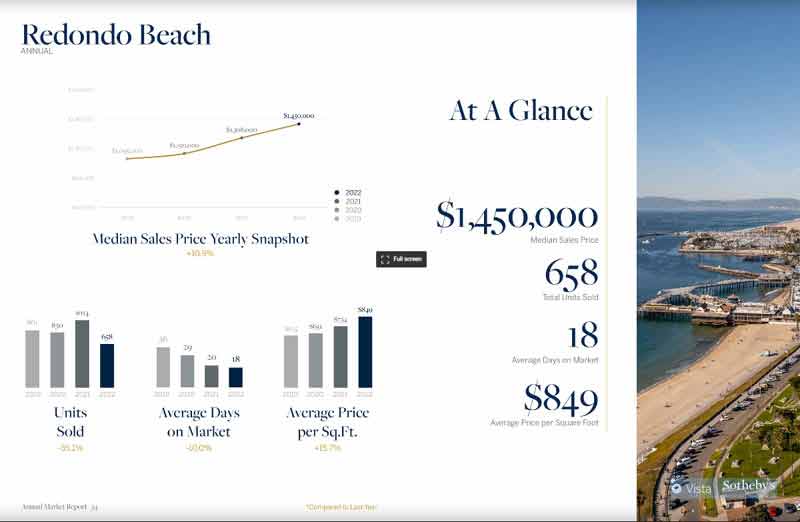
august 2021 Home Sales and Property Prices in Redondo Beach
Welcome to the real estate recap for August 2021 in Redondo Beach. It was another incredible month for home sales in Redondo CA with 82 on market home sales. The average list price was $1,330,821 with the average sales price of $1,385,527 meaning homes sold WAY above the asking price. Homes averaged only 17 days on market before going into escrow and the average price per foot was $783.
42 of the homes that sold were in North Redondo at an average sales price of $1,283,507
See how this compares with other months on our Redondo Beach real estate trends and statisics page.
View the current homes for sale in Redondo Beach California

Redondo Beach August 2021 Home Sales
| Type | Address | Price | $ Per Foot | Bed/Bath | Sq Feet | Year | Sold Date | |
| TWNHS/A | 157 | Paseo de la Concha #4 | $945,000 | $877.44 | 2/1,0,1,0 | 1077/P | 1977/PUB | 8/6/2021 |
| TWNHS/A | 6160 S | Pacific Coast HWY | $980,000 | $818.03 | 2/3,0,0,0 | 1198/B | 2020/BLD | 8/6/2021 |
| CONDO/A | 201 | Calle Miramar #17 | $1,000,000 | $693.48 | 2/2,0,0,0 | 1442/S | 1962/ASR | 8/11/2021 |
| SFR/D | 236 | Paseo De Gracia | $1,800,000 | $1,050.79 | 3/2,1,0,0 | 1713/A | 1952/ASR | 8/23/2021 |
| SFR/D | 123 | Camino De Las Colinas | $2,000,000 | $1,140.25 | 3/2,0,0,0 | 1754/A | 1950/ASR | 8/3/2021 |
| SFR/D | 124 | Paseo De Las Delicias | $2,100,000 | $1,135.14 | 3/2,0,1,0 | 1850/A | 1951/ASR | 8/11/2021 |
| SFR/D | 533 | Paseo De Las Estrellas | $2,700,000 | $738.92 | 4/1,2,1,0 | 3654/A | 1959/ASR | 8/3/2021 |
| SFR/D | 109 | Via La Soledad | $3,325,000 | $1,065.02 | 4/2,0,1,0 | 3122/B | 2008/ASR | 8/26/2021 |
| TWNHS/A | 2120 | Dufour AVE #10 | $775,000 | $631.62 | 2/2,0,0,0 | 1227/A | 1975/ASR | 8/3/2021 |
| TWNHS/A | 2510 | Voorhees AVE #4 | $775,000 | $648.54 | 2/1,0,1,1 | 1195/A | 1977/ASR | 8/16/2021 |
| CONDO | 2109 | Voorhees AVE #A | $935,900 | $689.68 | 2/3,0,0,0 | 1357/ | 1979 | 8/27/2021 |
| TWNHS/A | 2212 | Manhattan Beach BLVD #A | $977,000 | $534.76 | 3/3,0,1,0 | 1827/A | 1988/ASR | 8/18/2021 |
| TWNHS/D | 2310 | Gates AVE | $994,500 | $814.50 | 3/2,0,0,0 | 1221/P | 1977/ASR | 8/17/2021 |
| SFR/D | 1906 | Ruhland AVE | $1,035,000 | $811.13 | 2/1,0,0,0 | 1276/P | 1952/PUB | 8/20/2021 |
| TWNHS/D | 2605 | Voorhees AVE #A | $1,165,000 | $594.99 | 3/2,0,1,0 | 1958/P | 1992/ASR | 8/20/2021 |
| TWNHS/D | 2013 | Curtis AVE #B | $1,250,000 | $805.41 | 3/1,0,0,1 | 1552/A | 1978/ASR | 8/30/2021 |
| SFR/D | 2413 | Sebald AVE | $1,300,000 | $743.28 | 4/1,2,0,0 | 1749/P | 1945/PUB | 8/19/2021 |
| TWNHS/D | 2009 | FARRELL AVENUE #B | $1,345,000 | $558.79 | 4/3,0,1,0 | 2407/A | 1989/ASR | 8/25/2021 |
| TWNHS/A | 2218 | Graham AVE #A | $1,398,888 | $521.20 | 4/2,0,1,0 | 2684/A | 1993/ASR | 8/26/2021 |
| SFR/D | 2004 | Graham AVE | $1,460,000 | $1,243.61 | 3/1,0,1,0 | 1174/A | 1950/ASR | 8/31/2021 |
| TWNHS/D | 1916 | Perry AVE #A | $1,481,660 | $667.41 | 4/2,0,1,0 | 2220/A | 2004/ASR | 8/13/2021 |
| TWNHS/A | 2618 | Nelson AVE #A | $1,500,000 | $645.44 | 5/5,0,0,0 | 2324/D | 2021/BLD | 8/17/2021 |
| SFR/D | 2808 | Pinckard AVE | $1,570,000 | $1,095.60 | 3/1,0,0,0 | 1433/A | 1943/ASR | 8/10/2021 |
| TWNHS/D | 2110 | Ernest AVE #A | $1,710,000 | $656.93 | 4/3,0,1,0 | 2603/A | 2015/PUB | 8/19/2021 |
| TWNHS/D | 2204 | Bataan RD #A | $1,735,000 | $705.28 | 4/4,0,0,0 | 2460/A | 2016/ASR | 8/3/2021 |
| SFR/D | 2817 | May AVE | $1,800,000 | $754.40 | 3/2,0,1,0 | 2386/E | 1943/EST | 8/6/2021 |
| SFR/D | 2216 | Gates AVE #A | $1,875,000 | $580.50 | 4/3,0,1,0 | 3230/B | 2021/BLD | 8/13/2021 |
| CONDO/A | 2750 | Artesia BLVD #117 | $187,375 | $243.34 | 1/1,0,0,0 | 770/A | 2007/ASR | 8/26/2021 |
| CONDO/A | 1910 | Grant AVE #4 | $820,000 | $462.23 | 3/2,0,1,0 | 1774/A | 1978/ASR | 8/31/2021 |
| TWNHS/A | 1718 | Ruxton LN #A | $950,000 | $513.51 | 3/3,0,0,0 | 1850/A | 2007/ASR | 8/27/2021 |
| TWNHS | 1908 | Rockefeller LN #C | $1,111,111 | $705.47 | 3/2,0,0,0 | 1575/ | 1989 | 8/19/2021 |
| TWNHS/D | 2023 | Belmont LN #A | $1,300,000 | $584.01 | 4/2,0,1,0 | 2226/A | 1990/ASR | 8/27/2021 |
| TWNHS/D | 2011 | Havemeyer LN #A | $1,322,000 | $682.85 | 3/2,0,1,0 | 1936/A | 1986/ASR | 8/24/2021 |
| SFR/D | 1504 | Mackay LN | $1,350,000 | $834.36 | 4/3,0,0,0 | 1618/S | 1962/PUB | 8/4/2021 |
| TWNHS/A | 1908 | Belmont LN #A | $1,399,900 | $539.46 | 4/2,0,1,0 | 2595/AP | 1991/ASR | 8/19/2021 |
| TWNHS/D | 1713 | Clark LN #A | $1,475,000 | $682.87 | 4/2,0,1,0 | 2160/P | 2001/ASR | 8/17/2021 |
| DPLX/D | 1911 | Spreckels LN | $1,535,000 | $554.95 | 6/4,0,1,0 | 2766/AP | 1957/ASR | 8/18/2021 |
| SFR/D | 2309 | Ripley AVE | $870,000 | $1,033.25 | 3/1,0,0,0 | 842/A | 1959/ASR | 8/19/2021 |
| SFR/D | 2777 | 190th ST | $1,022,000 | $988.39 | 3/1,0,0,0 | 1034/A | 1955/ASR | 8/24/2021 |
| SFR/D | 1913 | 190th ST | $1,150,000 | $1,032.32 | 3/1,0,0,0 | 1114/A | 1955/ASR | 8/16/2021 |
| TWNHS/A | 630 | Meyer LN #D | $1,175,000 | $488.16 | 3/2,0,1,0 | 2407/P | 2002/PUB | 8/27/2021 |
| SFR/D | 2406 | Ripley AVE | $1,300,000 | $967.26 | 3/2,0,0,0 | 1344/A | 1976/ASR | 8/5/2021 |
| SFR | 2708 | 184th | $1,350,000 | 3/2,0,0,0 | / | 8/27/2021 | ||
| SFR/D | 2517 | Ralston LN | $1,450,000 | $1,167.47 | 3/2,0,0,0 | 1242/A | 1951/ASR | 8/17/2021 |
| SFR/D | 701 | Firmona AVE | $1,455,000 | $1,148.38 | 3/2,0,0,0 | 1267/A | 1955/ASR | 8/24/2021 |
| SFR/D | 1730 | Carver ST | $1,070,000 | $1,173.25 | 2/1,1,0,0 | 912/A | 1957/ASR | 8/13/2021 |
| SFR/D | 1705 | Carlson LN | $1,150,000 | $963.15 | 3/1,1,0,0 | 1194/A | 1962/ASR | 8/31/2021 |
| SFR/D | 1617 | Armour LN | $1,266,000 | $802.28 | 3/2,0,1,0 | 1578/A | 1957/ASR | 8/24/2021 |
| SFR/D | 1628 | Haynes LN | $1,425,000 | $734.91 | 3/2,0,1,0 | 1939/A | 1983/PUB | 8/12/2021 |
| SFR/D | 1506 | Wollacott ST | $1,435,000 | $803.47 | 3/2,0,0,0 | 1786/A | 1980/OTH | 8/13/2021 |
| SFR/D | 1725 | Armour LN | $1,500,000 | $797.45 | 3/2,0,1,0 | 1881/A | 2005/ASR | 8/31/2021 |
| SFR/D | 1645 | Carlson LN | $1,530,000 | $875.29 | 3/2,0,0,0 | 1748/A | 1981/ASR | 8/25/2021 |
| SFR/D | 1127 | Stanford AVE | $1,660,000 | $878.77 | 3/2,0,1,0 | 1889/A | 2004/ASR | 8/27/2021 |
| SFR | 1545 | Ford AVE | $1,700,000 | $877.19 | 3/3,0,0,0 | 1938/ | 1991 | 8/3/2021 |
| CONDO/A | 640 | The #304 | $752,000 | $1,214.86 | 1/1,0,0,0 | 619/A | 1974/ASR | 8/11/2021 |
| TWNHS/A | 227 S | Irena AVE #3 | $950,000 | $608.19 | 3/3,0,0,0 | 1562/A | 1981/BLD | 8/17/2021 |
| TWNHS/A | 108 S | Irena AVE #E | $999,900 | $610.44 | 3/1,1,1,0 | 1638/SEE | 1982/ASR | 8/10/2021 |
| SFR/D | 624 | Emerald ST | $1,000,000 | $1,189.06 | 2/1,0,0,0 | 841/A | 1908/ASR | 8/20/2021 |
| CONDO/A | 220 S | Helberta AVE #E | $1,200,000 | $611.93 | 3/2,0,1,0 | 1961/A | 1981/ASR | 8/3/2021 |
| SFR/D | 724 | Vincent Street | $1,637,500 | $678.33 | 4/2,0,1,0 | 2414/A | 1971/SEE | 8/11/2021 |
| DPLX/D | 528 N | Lucia AVE | $1,650,000 | $1,002.43 | 5/2,0,0,0 | 1646/A | 1949/ASR | 8/23/2021 |
| TWNHS/D | 118 S | Irena AVE #A | $1,650,000 | $647.06 | 3/2,0,1,0 | 2550/A | 2018/ASR | 8/19/2021 |
| TWNHS/D | 706 N | Lucia AVE #B | $1,690,000 | $657.59 | 4/3,0,1,0 | 2570/A | 2005/ASR | 8/10/2021 |
| SFR/D | 509 N | Paulina AVE | $1,735,000 | $861.47 | 3/1,1,1,0 | 2014/A | 1952/ASR | 8/27/2021 |
| TWNHS/D | 112 S | Francisca AVE #A | $2,200,000 | $875.10 | 4/3,0,0,0 | 2514/B | 2021/BLD | 8/9/2021 |
| SFR/D | 717 N | Lucia AVE | $2,725,000 | $676.01 | 5/3,0,1,0 | 4031/A | 1997/ASR | 8/11/2021 |
| CONDO/A | 800 | Camino Real #106 | $502,000 | $750.37 | 1/1,0,0,0 | 669/A | 1970/PUB | 8/16/2021 |
| CONDO/A | 605 S | Prospect AVE #306 | $595,000 | $889.39 | 1/1,0,0,0 | 669/A | 1970/ASR | 8/31/2021 |
| CONDO/A | 643 S | Prospect AVE #104 | $700,000 | $717.95 | 2/2,0,0,0 | 975/A | 1970/PUB | 8/12/2021 |
| TWNHS/D | 1800 S | Pacific Coast HWY #26 | $1,021,000 | $629.47 | 3/2,1,0,0 | 1622/A | 2000/ASR | 8/26/2021 |
| SFR/D | 508 S | Pacific Coast | $1,102,500 | $967.11 | 3/1,0,0,0 | 1140/A | 1920/ASR | 8/26/2021 |
| SFR/D | 700 | Rita ST | $1,250,000 | $1,070.21 | 2/2,0,0,0 | 1168/A | 1948/ASR | 8/17/2021 |
| SFR/D | 419 | Avenue F | $1,250,000 | $710.63 | 3/2,0,0,0 | 1759/A | 1959/ASR | 8/18/2021 |
| SFR/D | 1311 S | Gertruda AVE | $1,400,000 | $833.83 | 4/1,1,0,0 | 1679/A | 1955/ASR | 8/13/2021 |
| SFR/D | 607 S | Gertruda AVE | $2,625,000 | $631.62 | 5/4,0,0,0 | 4156/T | 2002/ASR | 8/17/2021 |
| SFR/D | 519 S | Juanita AVE | $2,680,000 | $708.81 | 5/2,1,1,0 | 3781/T | 1989/ASR | 8/19/2021 |
| SFR/D | 601 S | Gertruda AVE | $3,100,000 | $708.57 | 4/3,0,0,0 | 4375/A | 1990/PUB | 8/24/2021 |
| CONDO | 230 S | Catalina AVE #206 | $922,000 | $668.60 | 2/1,1,0,0 | 1379/ | 1974 | 8/13/2021 |
| CONDO/A | 120 | The Village #310 | $1,050,000 | $835.32 | 2/1,1,0,0 | 1257/A | 1980/ASR | 8/16/2021 |
| CONDO/A | 110 | The Village #411 | $1,100,000 | $751.88 | 2/2,0,0,0 | 1463/A | 1980/PUB | 8/18/2021 |
| TWNHS/A | 802 N | Catalina AVE | $1,550,000 | $571.96 | 4/3,0,1,0 | 2710/A | 2021/EST | 8/13/2021 |
| CONDO/A | 1321 | Beryl ST #302 | $685,000 | $571.31 | 2/2,0,0,0 | 1199/A | 1975/ASR | 8/5/2021 |
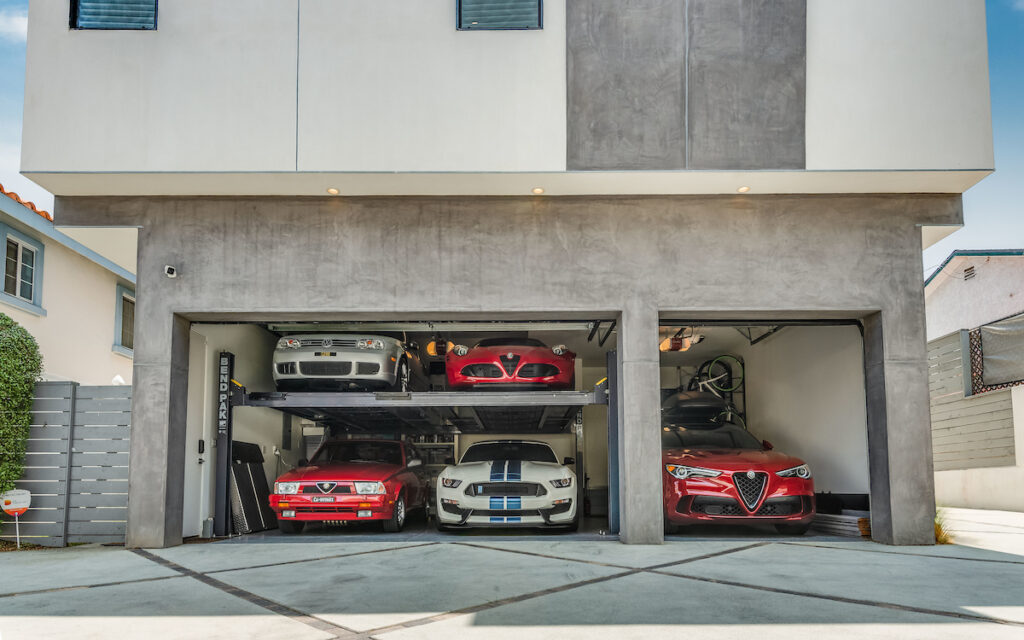
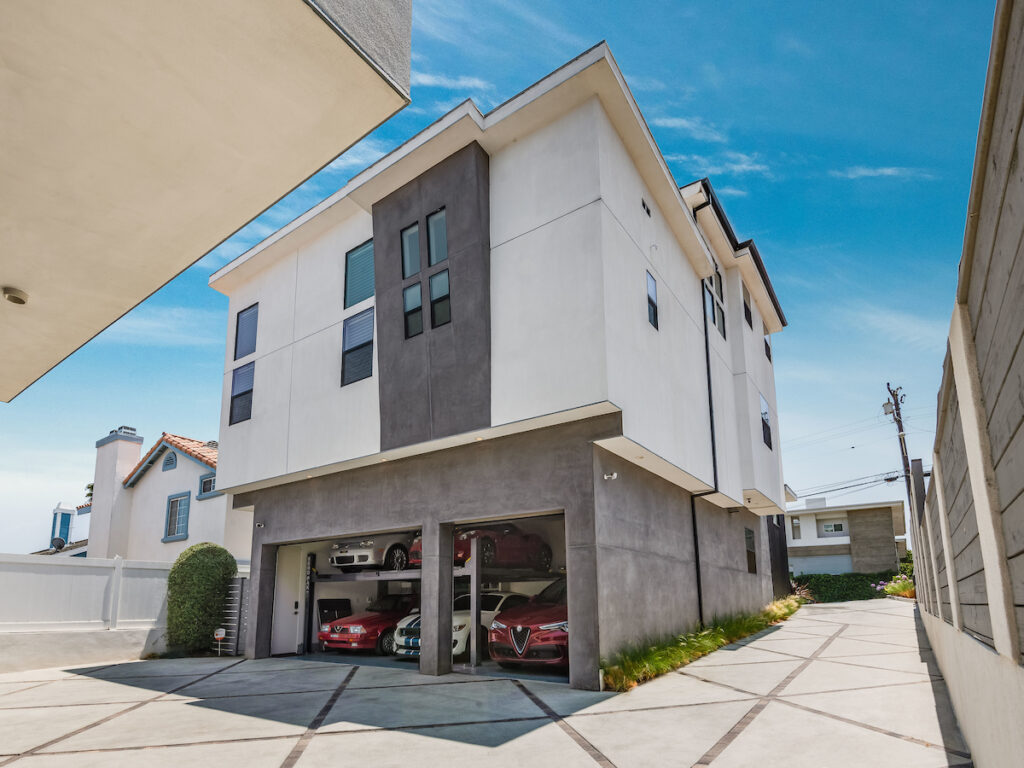
 Additional features on the first level include laundry room with a sink and custom storage, a mudroom/linen closet, under staircase storage, and a car enthusiasts dream garage. The double-height 3-car garage is unlike anything you’ve seen, with 3 side-by-side spaces and a Bendpak 2-car hydraulic lift so it can house 5 cars, or 3 cars with an elevated above-car storage space. If desired, the lift can be removed by the seller.
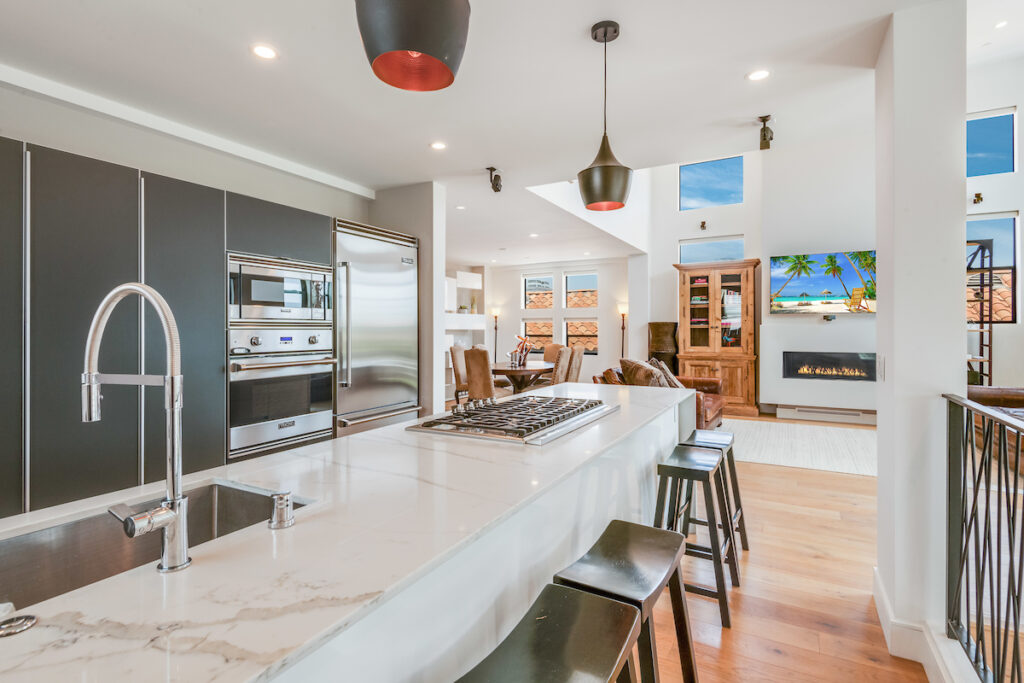
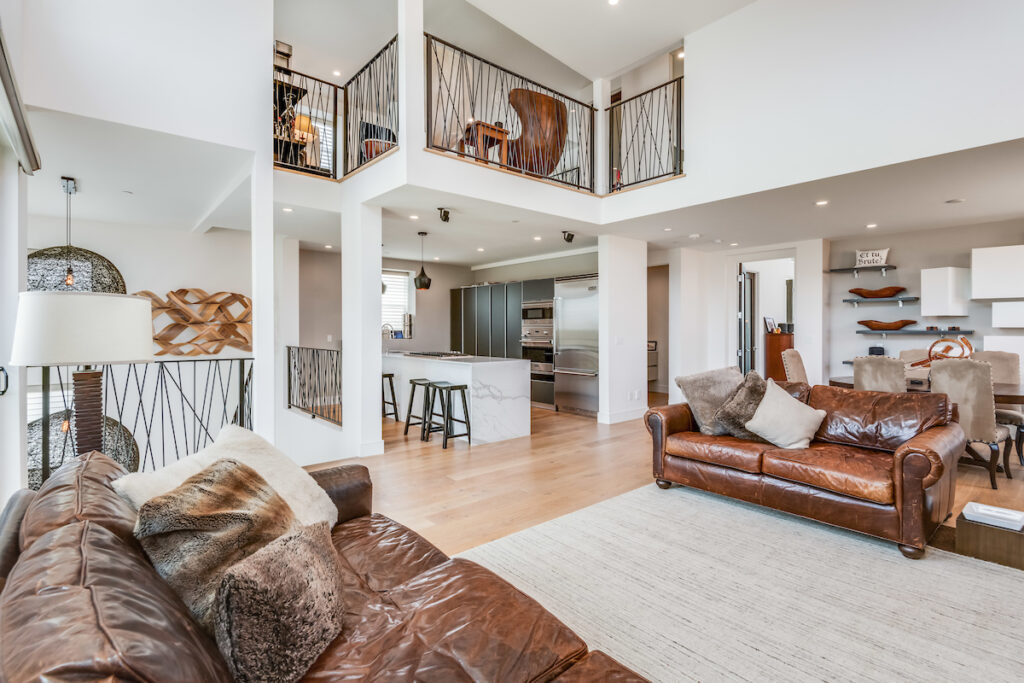
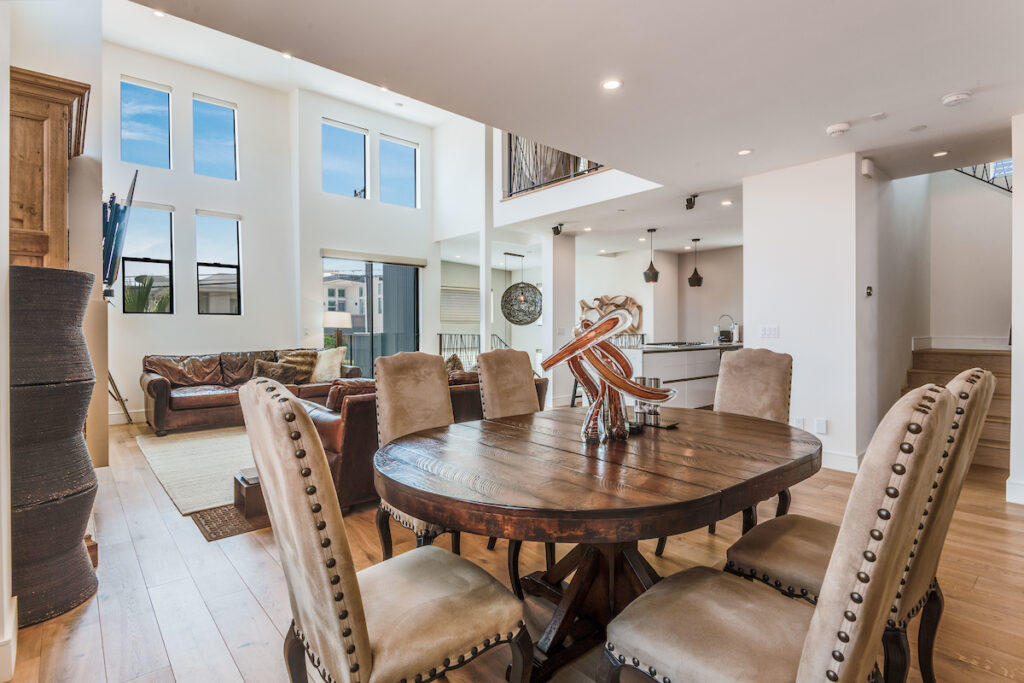
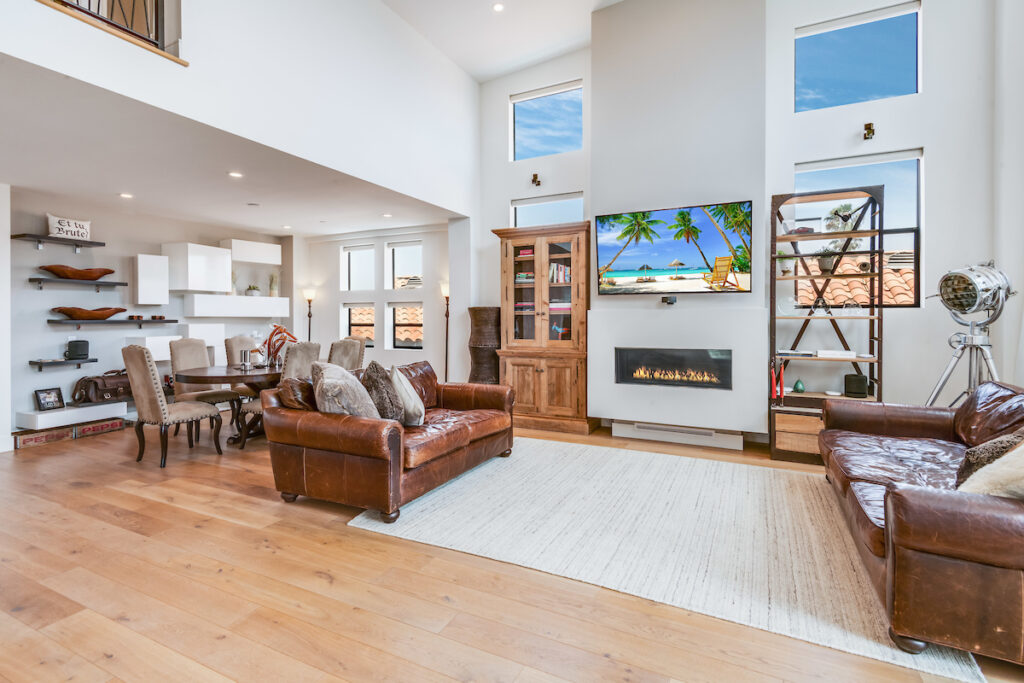
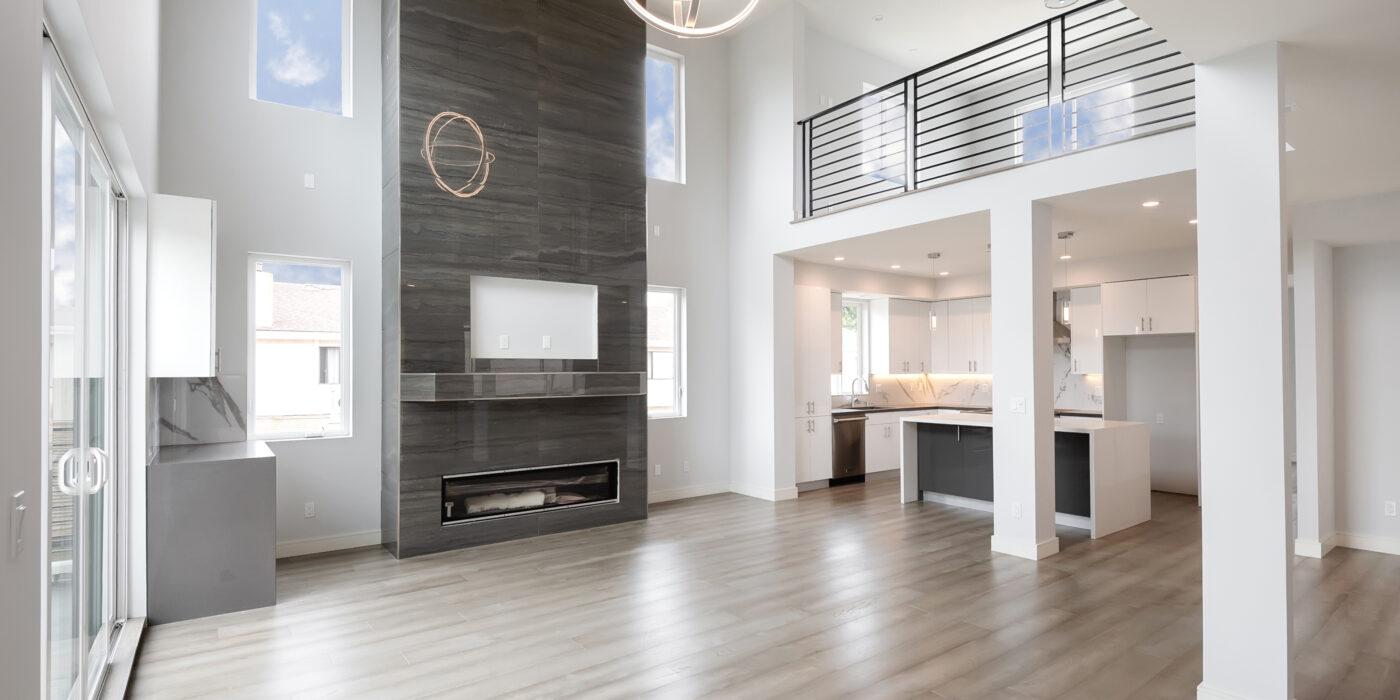
Head upstairs to the impressive living spaces with an incredible open floorplan for luxury living. Inspired design perfectly melds timeless and modern. Soaring ceilings, sophisticated window design, integrated sound, and a stunning floor to ceiling fireplace create a spectacular living environment perfect for relaxing or entertaining. The adjacent dining area features artistic floating cabinets, complemented by matching wide-plank oak floors.
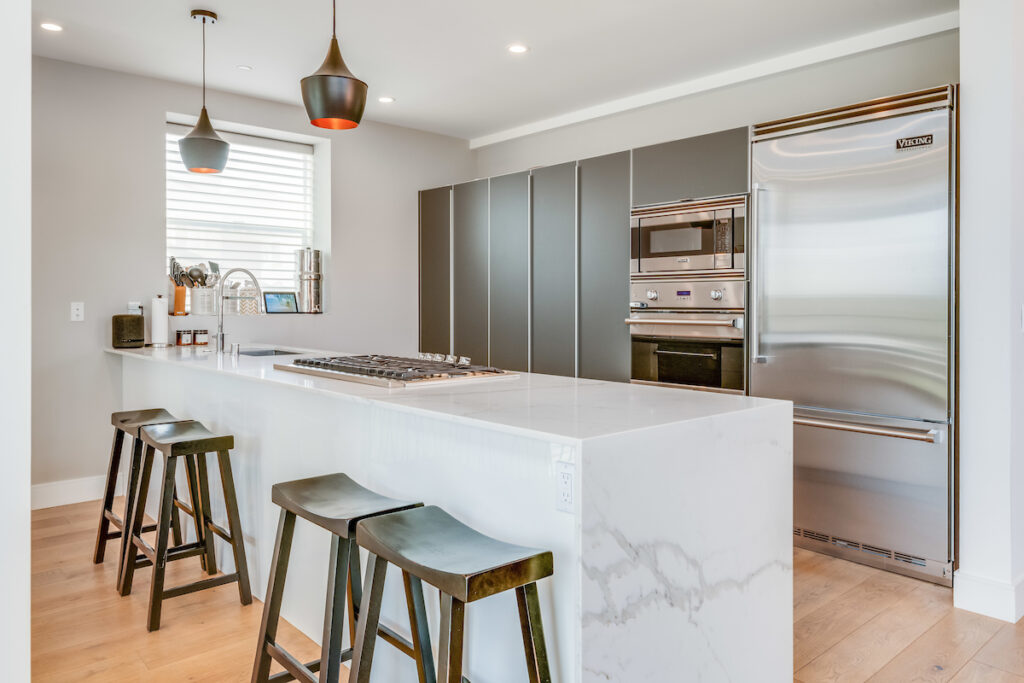
The dazzling kitchen is an entertainer’s dream. Minimalist design blends the 13ft quartz countertop with Viking Professional appliances and sleek glass cabinetry that houses appliances so they are hidden from view. This streamlined aesthetic currently houses an espresso machine, toaster and kettle, all concealed when not in use.
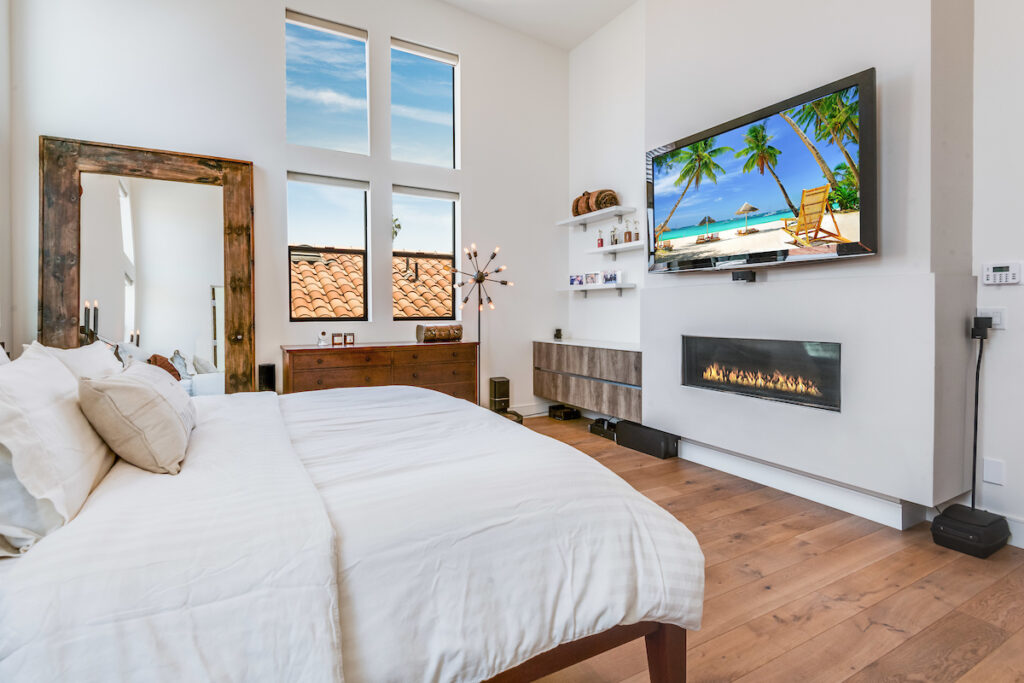
The main level primary suite is breathtaking, with high ceilings, an abundance of windows, voice-controlled shades and lighting, floor to ceiling gas fireplace, and elegant built-ins to make it a sophisticated retreat. It’s completed with an adjacent walk-in closet with feature hardwood wall, a private bathroom featuring a frameless shower, luxurious soaking tub, sleek dual vanity with quartz counter top, and a water closet.
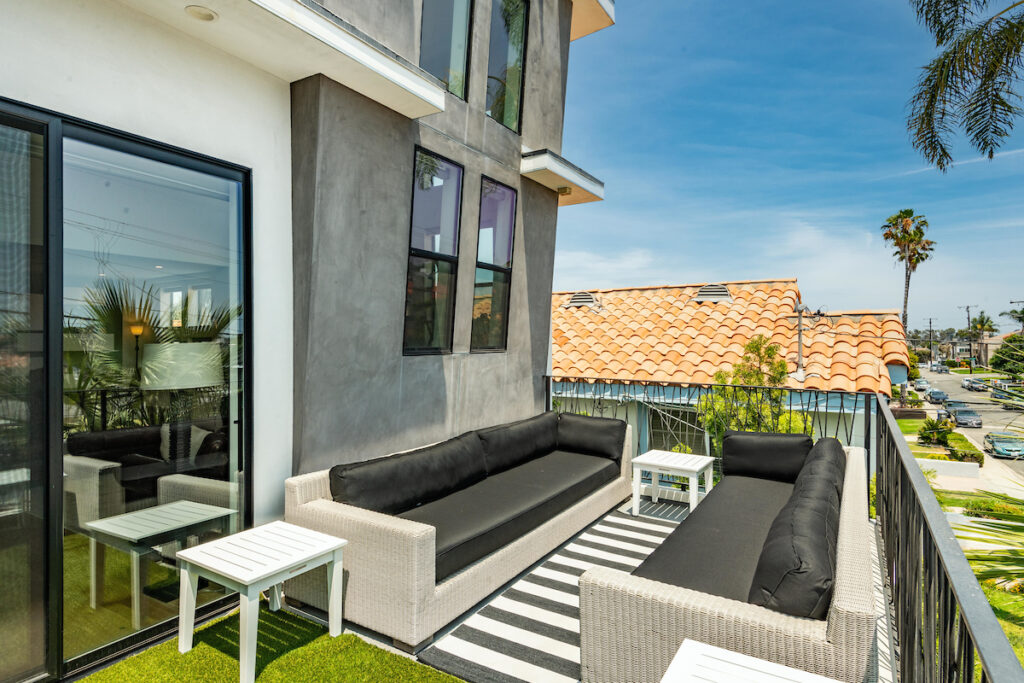
Also included on the second level is a beautiful powder room and a spacious outdoor deck off of the living room that perfectly integrates indoor and outdoor areas. Sit back and relax in the perfect weather on this private lanai.
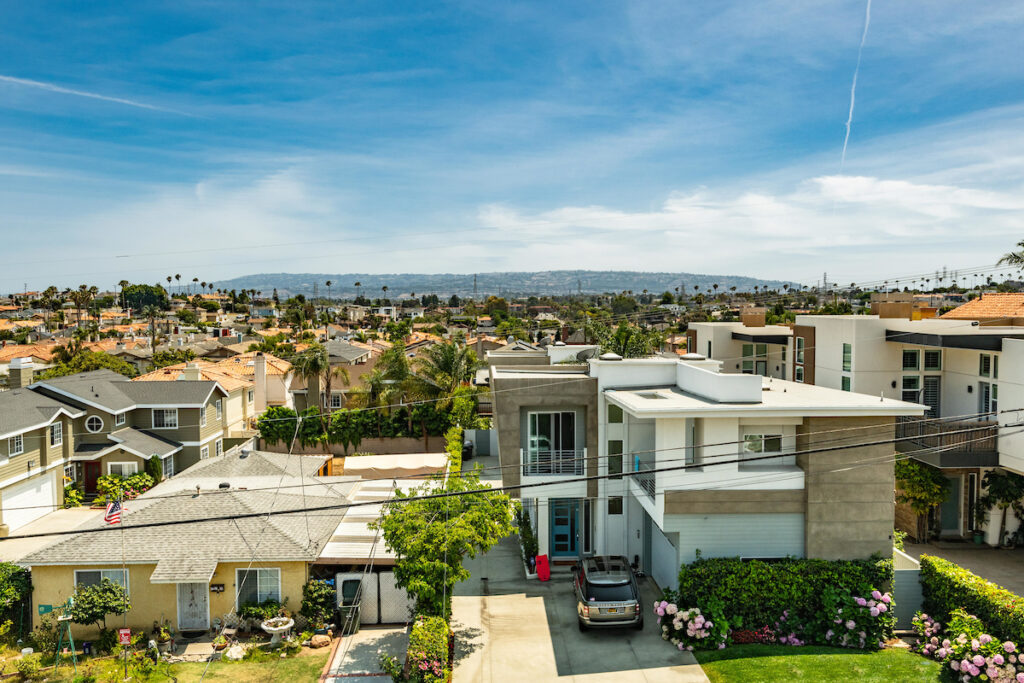
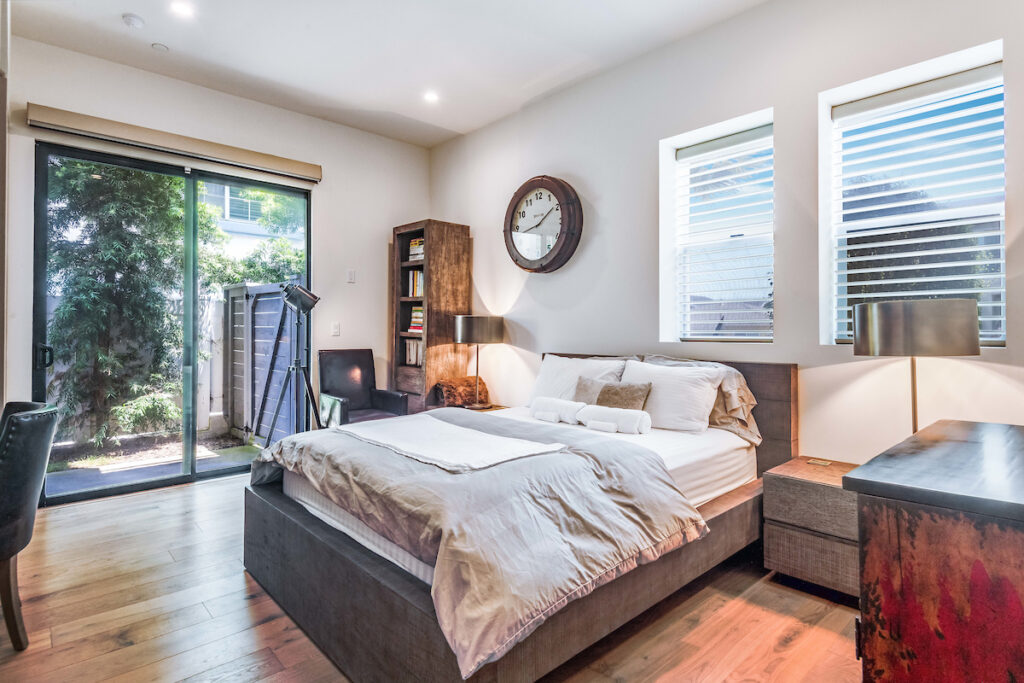
The large mezzanine level is ideal for just about any use from 4th bedroom to home office to gym to game room and more. This fantastic space features a private bathroom with frameless glass, spacious closet with built-in cabinets, and its own part-covered outdoor deck with fantastic city, mountain, PV and Sofi views. Perfect for guests or as your own private getaway.
Additional features on the first level include laundry room with a sink and custom storage, a mudroom/linen closet, under staircase storage, and a car enthusiasts dream garage. The double-height 3-car garage is unlike anything you’ve seen, with 3 side-by-side spaces and a Bendpak 2-car hydraulic lift so it can house 5 cars, or 3 cars with an elevated above-car storage space. If desired, the lift can be removed by the seller.
Head upstairs to the impressive living spaces with an incredible open floorplan for luxury living. Inspired design perfectly melds timeless and modern. Soaring ceilings, sophisticated window design, integrated sound, and a stunning floor to ceiling fireplace create a spectacular living environment perfect for relaxing or entertaining. The adjacent dining area features artistic floating cabinets, complemented by matching wide-plank oak floors.
The dazzling kitchen is an entertainer’s dream. Minimalist design blends the 13ft quartz countertop with Viking Professional appliances and sleek glass cabinetry that houses appliances so they are hidden from view. This streamlined aesthetic currently houses an espresso machine, toaster and kettle, all concealed when not in use.
The main level primary suite is breathtaking, with high ceilings, an abundance of windows, voice-controlled shades and lighting, floor to ceiling gas fireplace, and elegant built-ins to make it a sophisticated retreat. It’s completed with an adjacent walk-in closet with feature hardwood wall, a private bathroom featuring a frameless shower, luxurious soaking tub, sleek dual vanity with quartz counter top, and a water closet.
Also included on the second level is a beautiful powder room and a spacious outdoor deck off of the living room that perfectly integrates indoor and outdoor areas. Sit back and relax in the perfect weather on this private lanai.
The large mezzanine level is ideal for just about any use from 4th bedroom to home office to gym to game room and more. This fantastic space features a private bathroom with frameless glass, spacious closet with built-in cabinets, and its own part-covered outdoor deck with fantastic city, mountain, PV and Sofi views. Perfect for guests or as your own private getaway.