Tag: oceanfront homes
Hermosa Beach Sand Section Real Estate Update
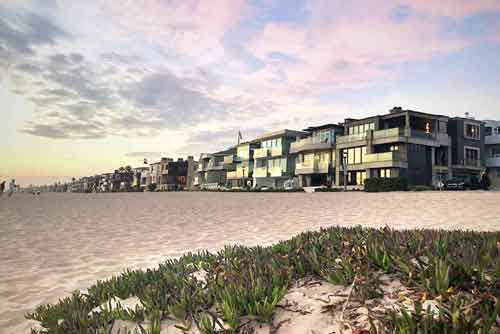
The inventory remains low in the sand section of Hermosa Beach with only 5 single family homes on the market in this very sought after area of the South Bay. The sand section is the area of Hermosa Beach from The Strand (Hermosa’s famous ocean front walk) to the greenbelt located at Valley and Ardmore and offers many homes that have tremendous ocean views and are in close proximity to the beach and downtown Hermosa and Pier Plaza.
[idx-listings community=”Hermosa Beach Sand” statuses=”1″ propertytypes=”516″ orderby=”DateAdded” orderdir=”DESC” count=”5″ showlargerphotos=”true”]
Oceanfront Homes For Sale on the Esplanade in Redondo Beach
Oceanfront Condos on The Esplanade in South Redondo
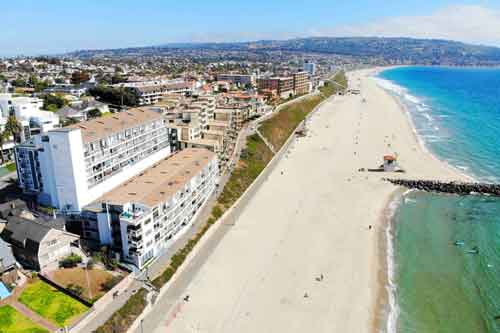
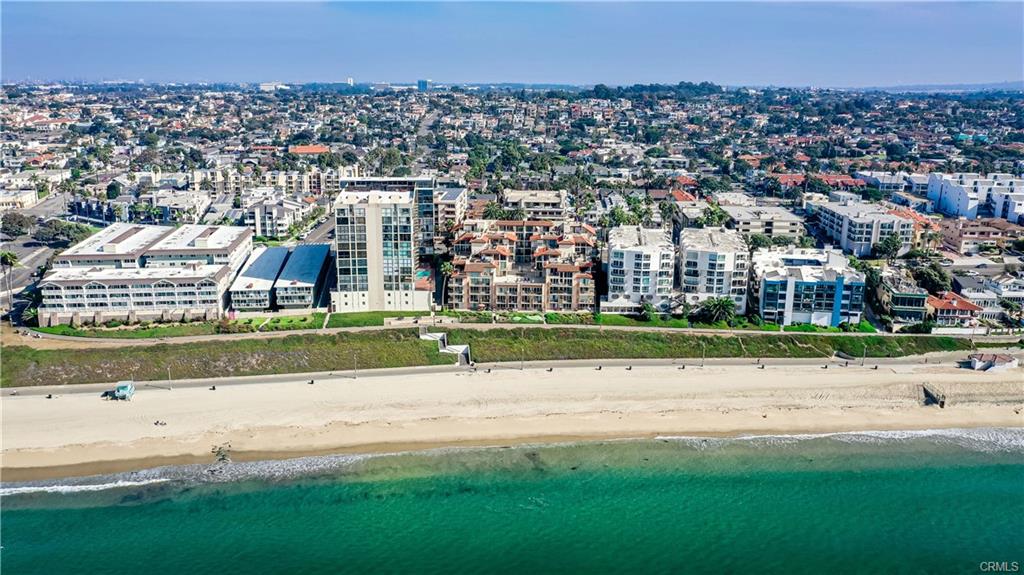
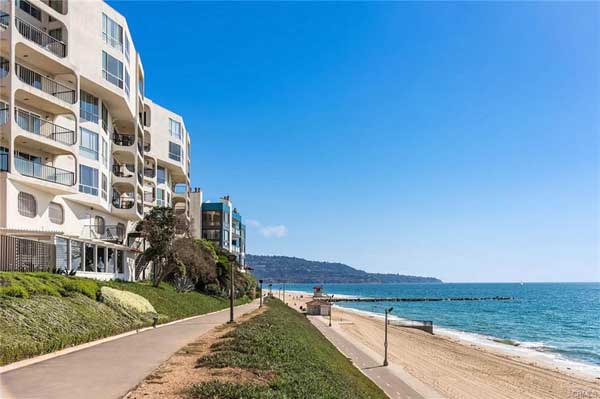
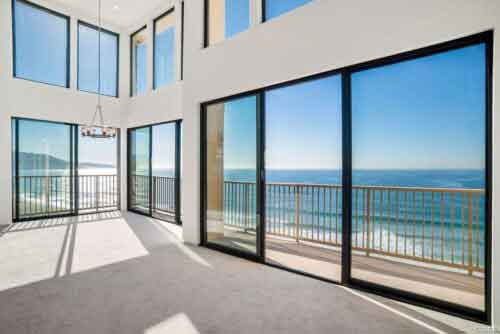
Living at the beach may be more affordable than you think as Redondo Beach zoning allows for larger ocean front condo buildings not seen in other areas of the South Bay. At the moment there are far more oceanfront condos, townhomes and homes for sale then in recent memory. The current homes range from 1 bed 1 bath condos in the Sand Castle, to one of the more impressive oceanfront homes ever to come on the market at 717 Esplanade. 7 of the current homes for sale are ocean front condos on the Esplanade with the bulk of the additional opportunities being single family or multi unit. The home at 739 Esplanade is one of the more intriguing properties as it’s currently 3 separate levels, each with kitchen and baths that can be torn down with the ability to build townhomes, or a very large estate, but may also work as an owner occupied investment property with owners living in one of the 3 levels and renting the other two.
See the current oceanfront homes for sale on the Esplanade in South Redondo Beach
Hermosa Beach Sand Section Home Prices Reaching New Levels
Although median prices in a luxury market such as the Hermosa Beach sand section can vary dramatically due to one or two oceanfront home listings on The Strand, the median home prices for active listings has reached record highs. The sand section of Hermosa Beach is the area closest to the ocean and is bordered by Manhattan Beach to the north, the streets of Valley/Ardmore to the east, and Redondo Beach to the south. There are numerous housing options ranging from magnificent Strand homes, to “walkstreet” homes with an alley in the back but a pedestrian only sidewalk in the front, to endless ocean view condos, townhomes and single family. In general prices are higher north of Pier Avenue.
According to local realtor and Hermosa Beach resident Keith Kyle with South Bay Brokers “the homes active on the market are almost all exclusively very high end luxury homes and we’ve reach a median home price never seen before.” The current median home price for all types of active homes is at $3,749,000. This in a town where the median prices have hovered in the $1.1M-$1.2M in general for the past few years. There are many factors at the moment including a number of ocean front homes including 2666 The Strand, an oceanfront estate priced at a whopping $15,900,000 (incredibly it was raised from it’s original $13,900,000), 718 The Strand at $6,300,000 and 5 other homes priced over $4.0M with 3 walkstreet homes for sale.
[idx-listings community=”Hermosa Beach Sand” propertytypes=”513″ orderby=”Price” orderdir=”DESC” count=”5″]
Manhattan Beach Sand Section Market Update
Manhattan Beach Sand Section Homes Report
The sand section of Manhattan Beach offers the epitome of California coastal
living. The sand section is the area of Manhattan Beach that is bordered by the beach and ocean to the west, and generally the streets of Valley and Ardmore to the east. What makes this area so desirable is the proximity to the beach and the ocean. The area offers a variety of housing options with oceanfront luxury homes on The Strand, beautiful “walk street” homes with a wonderful sense of community and often sweeping ocean views, townhomes just a few blocks to the beach, and multi unit homes of North Manhattan, known as El Porto. The market is always very active as the demand is always strong for prime beach real estate. As of mid March there are 9 active homes for sale in the Manhattan Beach sand section, 21 pending home sales and 18 closed homes sales as of February 1st. According to Manhattan Beach realtor Keith Kyle, “Incredibly low inventory coupled with very high demand since the beginning of the year is driving prices up quickly. There are many buyers looking in this luxury market, but there are very few listings and even homes priced at market value are often selling with multiple offers, over asking and with huge concessions by the buyers.” The current average sales price since the beginning of February has been slightly over $2,300,000. See the chart below to see the market by the numbers.
| Active MLS Listings – Currently there are 9 active homes for sale in the Manhattan Beach Sand Section | |||||||||
| List Price | ADOM | BR | BA | Year Built | SqFt | Lot SqFt | |||
| Min | 1,179,000 | 2 | – | 2 | 2.00 | 1933 | 1,392 | 1,153 | |
| Max | 6,750,000 | 19 | – | 5 | 6.00 | 2013 | 5,000 | 3,772 | |
| Avg | 3,207,889 | 10 | – | 4 | 4.00 | 1990 | 3,012 | 2,216 | |
| Sum | 28,871,000 | – | |||||||
| 8 Pending home Sales – 21 Total “In Escrow” | |||||||||
| List Price | ADOM | BR | BA | Year Built | SqFt | Lot SqFt | |||
| Min | 975,000 | – | 2 | 2.00 | 1946 | 1,082 | 1,350 | ||
| Max | 2,499,000 | 105 | – | 5 | 4.00 | 2009 | 2,989 | 5,885 | |
| Avg | 1,854,750 | 31 | – | 3 | 3.38 | 1982 | 2,040 | 2,855 | |
| 13 Pending Sales in Backup Offer Status | |||||||||
| List Price | ADOM | BR | BA | Year Built | SqFt | Lot SqFt | |||
| Min | 925,000 | 5 | – | 2 | 1.00 | 1921 | 982 | 1,345 | |
| Max | 6,995,000 | 73 | – | 5 | 5.00 | 2007 | 5,000 | 4,930 | |
| Avg | 2,519,538 | 36 | – | 4 | 3.69 | 1988 | 2,602 | 2,577 | |
| 18 Closed Home Sales since 2/1/2013 | |||||||||
| List Price | ADOM | Selling Price | BR | BA | Year Built | SqFt | Lot SqFt | ||
| Min | 1,199,000 | 1,214,500 | 2 | 2.00 | 1927 | 1,350 | 990 | ||
| Max | 11,500,000 | 449 | 10,995,000 | 5 | 5.00 | 2012 | 4,761 | 3,507 | |
| Avg | 2,409,278 | 78 | 2,362,350 | 3 | 3.72 | 1987 | 2,281 | 2,562 | |
| Sum | 43,367,000 | 42,522,300 | |||||||
| Status: All (48) | |||||||||
| List Price | ADOM | Selling Price | BR | BA | Year Built | SqFt | Lot SqFt | ||
| Min | 925,000 | 1,214,500 | 2 | 1.00 | 1921 | 982 | 990 | ||
| Max | 11,500,000 | 449 | 10,995,000 | 5 | 6.00 | 2013 | 5,000 | 5,885 | |
| Avg | 2,496,458 | 46 | 2,362,350 | 3 | 3.71 | 1987 | 2,465 | 2,549 | |