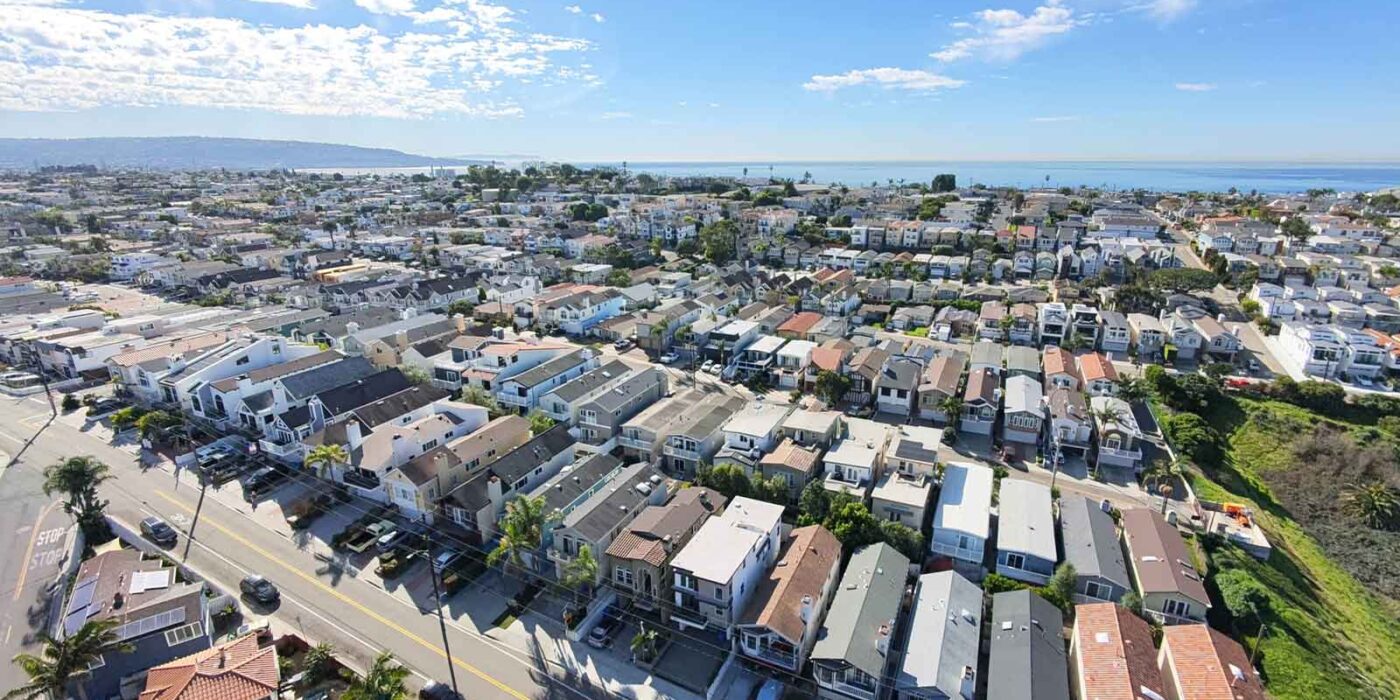
Golden Hills homes in Redondo Beach

60 Redondo Beach Home Sales in July at $1,686,027 Average

Redondo Beach Real Estate Market Recap – July 2026

62 Redondo home sales with $1,662,439 average home price

The Redondo Beach housing market remained strong in July 2026, with 60 homes sold and an average sales price of $1.686 million, up from $1.66 million in June. The median sales price also increased to $1.579 million, compared to $1.576 million the previous month, reflecting continued buyer demand.

While closed sales dipped slightly from 62 in June to 60 in July, home values continued to trend higher. The average price per square foot was $899, highlighting ongoing appreciation across the market despite a modest slowdown in transaction volume. 

The average asking price was $1,691,081 with the average sold price at $1,686,027 meaning homes generally sold for close to full price.

Of the homes that sold 29 were in north Redondo Beach 90278 with a $1,543,283
average price and 40 days on market.

24 were in south Redondo Beach or 90277 with an average price of $1,669,225 and 53 average days on market.

The remainder were located in the Hollywood Riviera which has a 90277 (South Redondo Beach) zip code but is actually in the city of Torrance.

July 2026 Home Sales and Prices in Redondo Beach

Type Address Sold price Beds & Baths Sq feet Age
TWNHS 431 Camino De Las Colinas $1,425,000 3/2,0,1,0 1827 1978
TWNHS 155 Calle Mayor $1,470,000 2/1,1,1,0 1545 1977
SFR 348 Calle De Andalucia $1,764,000 3/2,0,1,0 1401 1948
SFR 464 Calle De Castellana $2,700,000 3/2,0,0,0 2113 1953
SFR 208 Paseo De Granada $3,462,000 3/1,2,0,0 2942 2008
SFR 406 Via Mesa Grande $4,199,000 4/3,0,1,0 3000 2008
CONDO 2308 Curtis #4 $954,000 3/2,0,0,0 1142 1974
TWNHS 1917 Nelson Avenue #E $1,112,500 3/2,0,1,0 1254 1981
SFR 2022 Graham Ave $1,175,000 4/2,0,1,0 1686 1965
TWNHS 2503 Perkins LN $1,210,000 4/3,0,0,0 1641 2001
TWNHS 2618 Curtis $1,230,000 3/3,0,0,0 1790 2004
TWNHS 2109 Curtis AVE #A $1,438,120 3/2,0,1,0 2137 1986
TWNHS 2313 Nelson AVE #A $1,580,000 4/3,0,1,0 2701 2001
TWNHS 2622 Curtis Ave $1,875,000 5/4,0,1,0 2775 2026
TWNHS 2224 Gates AVE #B $1,900,000 4/4,0,0,0 2700 2016
SFR 2002 Curtis AVE $1,907,000 3/2,0,0,0 1190 1955
SFR 2501 Curtis $2,000,000 4/2,2,0,0 2848 2026
SFR 2500 Phelan Lane $2,026,000 5/3,1,0,0 2807 2026
CONDO 2707 Carnegie LN #Unit 1 $799,000 2/1,0,1,0 1387 1978
TWNHS 1911 Rockefeller LN #F $945,000 2/1,0,1,0 1258 1977
TWNHS 1710 Grant #14 $1,155,000 3/3,0,0,0 1885 1974
TWNHS 2012 Harriman #A $1,550,000 4/0,3,1,0 3006 1990
TWNHS 2007 Belmont Ln #B $1,579,000 4/3,0,0,0 2138 1992
TWNHS 1821 Speyer #B $1,600,000 4/2,0,1,0 2206 1990
TWNHS 2604 Grant AVE #B $1,600,000 4/4,0,0,0 2193 2025
TWNHS 1801 Harriman LN $1,815,000 4/2,0,1,0 2392 1986
TWNHS 2205 Marshalfield #B $2,099,000 4/3,0,1,0 2233 2026
SFR 2618 182nd $1,280,000 3/1,0,0,0 835 1953
SFR 717 High $2,290,000 6/5,0,0,0 3701 2000
SFR 1609 Carver ST $1,329,750 4/1,0,1,0 1399 1964
SFR 1825 Goodman Ave $1,457,838 3/1,1,0,0 1331 1967
SFR 1113 Ford $1,535,000 3/2,0,0,0 1640 1969
SFR 1743 Stanford $1,577,000 3/2,0,0,0 2447 1981
SFR 1618 Carver Street $1,875,000 3/2,0,1,0 1881 1981
SFR 1621 Carver ST $1,885,000 3/2,0,1,0 1872 1992
TWNHS 509 N Juanita AVE #5 $1,125,000 3/2,0,1,0 1675 1981
TWNHS 234 N Irena #3 $1,320,000 3/2,0,1,0 1963 1988
SFR 416 N Prospect Ave $1,475,000 4/2,0,1,0 1760 1965
TWNHS 217 S Helberta AVE #5 $1,520,000 3/2,0,1,0 2015 1981
SFR 610 Carnelian $2,165,000 7/3,0,0,0 2546 1909
TWNHS 110 S Irena AVE #A $2,225,000 4/4,0,0,0 2400 2025
TWNHS 519 Emerald $2,298,000 4/3,0,1,0 2588 2026
TWNHS 617 N Irena AVE #C $2,795,000 5/3,0,1,0 3200 2026
CONDO 607 S Prospect #306 $547,000 1/1,0,0,0 669 1970
CONDO 814 Camino Real #203 $665,000 2/1,1,0,0 949 1970
CONDO 826 Camino Real #202 $675,000 2/2,0,0,0 949 1970
SFR 318 S Francisca AVE $900,000 1/2,0,0,0 1157 1920
SFR 405 Pearl ST $1,680,000 4/2,0,0,0 1884 1961
SFR 507 Faye LN $1,900,000 4/3,0,0,0 2148 1969
SFR 336 Avenue E $1,900,000 3/1,0,0,0 1128 1950
SFR 1300 S Gertruda $2,004,888 3/3,0,0,0 1920 1954
SFR 1038 Avenue D $3,320,000 4/3,1,0,0 3617 2006
CONDO 615 Esplanade #508 $760,000 1/1,0,0,0 719 1971
CONDO 625 Esplanade #29 $1,095,000 2/2,0,0,0 1394 1974
DPLX 218 N Broadway $1,300,000 2/2,0,0,0 1238 1911
CONDO 727 Esplanade #306 $1,822,500 2/2,0,0,0 1419 1974
TWNHS 150 The Village #6 $1,875,000 3/2,0,0,0 1923 1980
SFR 204 Avenue E $2,320,000 3/2,0,0,0 1866 1949
CONDO 555 Esplanade #620 $2,399,000 3/2,1,0,0 1733 1976
SFR 2728 Ralston $1,325,000 3/3,0,0,0 1605 1955

This web site may reference real estate listing(s) held by a brokerage firm other than the broker and/or agent who owns this website. The accuracy of all information is deemed reliable but not guaranteed and should be personally verified through personal inspection by and/or with the appropriate professionals

March 2016 Median Home Prices for Redondo Beach and the South Bay.

By Keith Kyle

The numbers for March are in Redondo Beach saw another solid month with  89 homes sold in Redondo Beach and a median home price of $893,000 which was slightly up from the previous month.  There is a healthy number of new construction projects coming out in both north and south Redondo which is helping keep the home prices up.

City Homes
Sold
March
2016 Median
March
2015 Median
Year
over Year % Change%
Carson 54 $447,500 $426,500 4.9%
El Segundo 10 $1,006,000 $849,000 18.5%
Gardena 58 $475,000 $403,500 17.7%
Harbor City 14 $450,000 $455,000 -1.1%
Hawthorne 36 $513,000 $642,000 -20.2%
Hermosa Beach 16 $1,183,000 $1,310,000 -9.7%
Lawndale 10 $385,000 $447,000 -13.9%
Lomita 11 $530,000 $481,000 10.1%
Long Beach 327 $478,000 $414,000 15.3%
Manhattan Beach 41 $2,275,000 $1,940,000 17.3%
Marina Del Rey 18 $1,025,000 $860,000 19.2%
Palos Verdes Estates 28 $1,355,000 $1,400,000 -3.2%
Playa Del Rey 18 $560,000 $546,000 2.6%
Rancho Palos Verdes 56 $1,156,250 $1,044,500 10.7%
Redondo Beach 89 $893,000 $862,000 3.7%
San Pedro  80 $554,000 $481,000 15.1%
Torrance 133 $615,000 $530,000 16%
Westchester 25 $910,000 $854,000 6.6%
Breakwater Village 55+ condos in Redondo Beach

September 2015 Home Sales in Redondo Beach and Beyond

By Keith Kyle

Redondo Beach saw an impressive number of homes selling in September of 2015 to end the summer selling season with 97 closed escrows.  In addition the median home price in Redondo was $875,000 which shows significant gains in value over the past year.  The market was hot throughout Redondo Beach with homes in both North and South Redondo often selling quickly and with multiple offers.

City Homes
Sold
September
2015 Median
September
2014 Median
Year
over Year % Change
Carson 49 $406,000 $366,000 10.8%
El Segundo 9 $1,045,000 $517,000 76%
Gardena 33 $440,000 365,000 20.5%
Harbor City 18 $514,500 $462,500 11.2%
Hawthorne 27 $513,000 $550,000 -6.7%
Hermosa Beach 20 $1,200,000 $1,020,000 17.7%
Lawndale 13 $450,000 $379,000 18.6%
Lomita 15 $580,000 $570,000 1.8%
Long Beach 390 $435,000 $420,000 3.7%
Manhattan Beach 39 $2,050,000 $2,025,000 1.2%
Marina Del Rey 29 $865,000 $817,000 5.9%
Palos Verdes Estates 35 $1550,000 $1575,000 -1.6%
Playa Del Rey 18 $542,000 $534,000 1.6%
Rancho Palos Verdes 49 $1,040,000 $1,058,000 -1.7%
Redondo Beach 97 $875,000 $790,000 10.8%
San Pedro 69 $442,000 $459,000 -3.6%
Torrance 135 $585,000 $527,00 10.9%
Westchester 26 $908,000 $872,000 4.1%
South Bay open houses

Big Weekend for Redondo Beach Open Houses

By Keith KyleSouth Bay open houses

During a week in which most other South Bay cities are only offering a very limited number of homes to see, the open house schedule for September 20th and 21st in Redondo Beach has plenty to offer….and plenty to tour.  This weekend sees more than usual with several advertised open houses.  See the list below for Redondo Beach and the South Bay open houses.  If you’re seeing this post after the September dates please visit our South Bay open houses site for updated homes for sale and schedules.


Redondo Beach Hollywood Riviera

Why Homes are More Expensive in South Redondo than North Redondo Beach

Why South Redondo Homes Cost More than North Redondo Homes

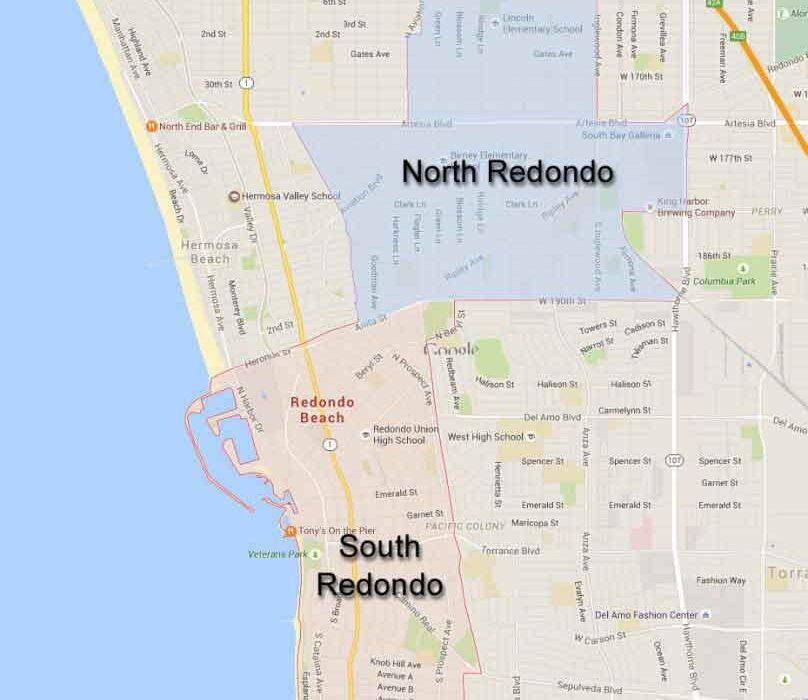
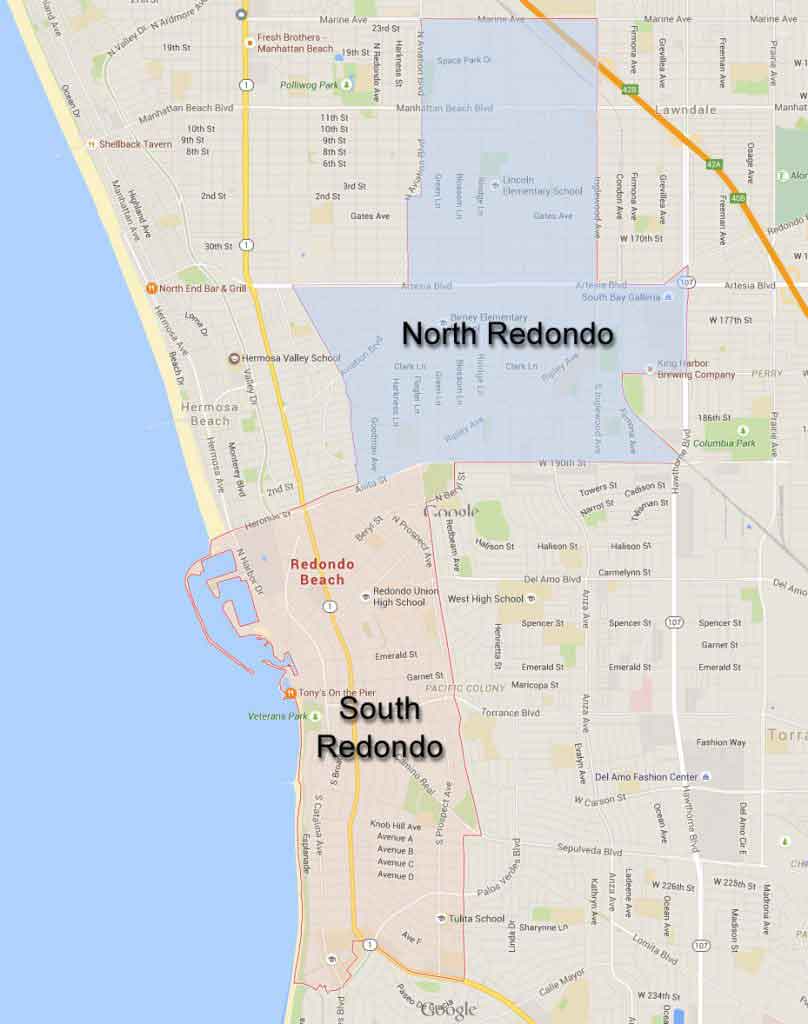
For buyers (and sometimes even sellers) unfamiliar with the differences in local market in the South Bay, Redondo Beach is just one single real estate market.  In reality the differences between neighborhoods can be significant and home values and prices show a clear distinction between similar homes in North Redondo and South Redondo.    The city has a number of distinctive neighborhoods but the main sections are broken into North and South and the dividing line is basically 190th Street.  North Redondo is quite a bit less expensive due to the location as it sits behind Hermosa and Manhattan Beach so there are no homes with ocean views and the feel of the area is different as it’s not along the water.  South Redondo ends at the beach and the ocean to the west and has a unique beach charm and homes often have great views.  The recent listings and sales of very similar homes, both in terms of style, layout, size and new construction, make clear the differences in values.

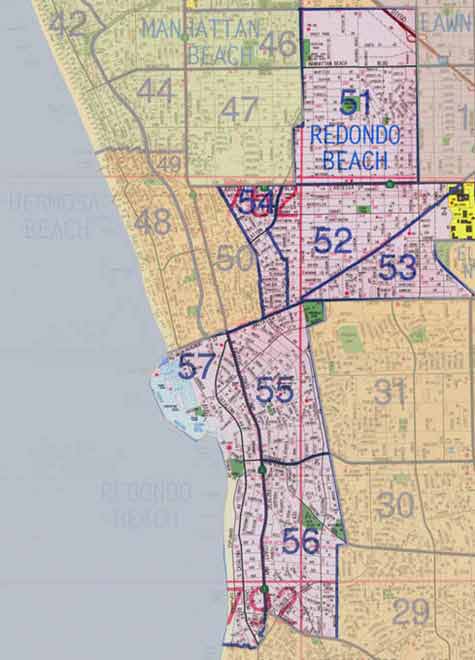
Below is a map showing the general layout, location and dividing lines between north and south Redondo Beach

 Areas 151-154 are North Redondo and 155-157 are South Redondo

Redondo Beach real estate map
Redondo Beach map

What’s the difference between North and South Redondo Beach?

By Keith Kyle

Redondo Beach is a wonderful city in the South Bay offering housing options forRedondo Beach map just about every buyer.  The city is a rather odd shape and is squeezed in between Manhattan Beach, Hermosa Beach, Lawndale, Hawthorne and Torrance.   Unlike some of it’s neighbors the zoning in Redondo Beach has allowed for far more styles and types of homes ranging from large condo complexes, retirement communities, 2 on a lot and 3 on a lot townhomes, and single family homes.
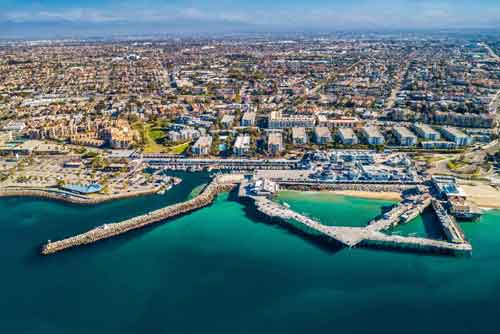
From a real estate standpoint the city of Redondo Beach is broken into two distinct areas…..North Redondo and South Redondo.  Each has a very different feel and a fairly different price range. The general dividing line is generally at 190th Street.

So what’s the difference?

The primary difference is the location and the “feel” the areas have due to that location.

North Redondo is landlocked between Manhattan Beach, Hermosa Beach, Hawthorne, Lawndale and Torrance.  The area , with the zip code of 90278, has some great housing options that are generally priced lower than South Redondo beach but none of the neighborhoods have much of a coastal feel and none of the areas offer any type of ocean views.  One of the most prevalent types of homes in North Redondo are townhomes but may not be what many think of when they think of endless rows of identical homes.  The main types of townhomes in Redondo are known as 2 on a lot and 3 on a lot townhomes.  The entire “complex” consists of 2 or 3 units and many, especially when detached, feel like single family homes. Some of the more notable neighborhoods are the Golden Hills which lies just east of Hermosa and offers primarily single family homes with square footage around 1800 feet. The other area consisting of primarily single family homes in on the eastern border and known as the TRW tract.  Throughout North Redondo there is a mix of types and styles and prices generally range from the low $500Ks to over $1,000,000.   Visit the North Redondo listings page to see the current homes for sale in this part of Redondo Beach.

South Redondo sits on some pristine coastline and has a much “beachier” feel.  Due to zoning this part of town has some very large condo complexes, especially along the water.  South Redondo with the zip code of 90277, offers numerous two on a lot townhomes (3 on a lot townhomes are more rare in this part of town), condo complexes and single family homes.  Some of the more well known buildings are the Seascape condos near King Harbor, the various oceanfront buildings of the Esplanade, The Village, and Brookside Village.  Prices range dramatically due to the factors of proximity to the beach and the ocean views but is consistently higher priced than North Redondo.  In addition to the beach, this part of town offers an abundance of activities and sites from King Harbor and the Redondo Pier, to Riviera Village, Seaside Lagoon, Wilderness Park and more.  The schools are great in both areas.

As mentioned, prices range higher than in the North Redondo area.  To see the current homes for sale in South Redondo visit our South Redondo real estate information page.


ARE YOU INTERESTED

IT'S TIME TO DISCOVER

redondo beach

Vista Sotheby's International

Vista Sotheby’s International Realty is one of the top real estate brokerages in the South Bay and Southern California with offices in Redondo Beach and throughout the South Bay

ADDRESS:

1801 S Catalina Ave, Redondo Beach, CA 90277

Phone:

310.251.2344

E-mail:

keith.kyle@vistasir.com

CONTACT AGENT

DRE#01712785

keith kyle

Top Producing Realtor

ENQUIRE

Sotheby's International

Welcome to Sotheby's International Realty representing buyers and sellers of fine South Bay and Southern California properties

Redondo Beach Real Estate & Homes. All rights reserved. Information deemed reliable but not guaranteed

Keith Kyle – Licensed Realtor – Vista Sothebys International Realty – DRE#01712785

The listing information set forth on this site is based upon information which we consider reliable, but because it has been supplied by third parties to our franchisees (who in turn supplied it to us), we cannot represent that it is accurate or complete, and it should not be relied upon as such. The offerings are subject to errors, omissions, changes, including price, or withdrawal without notice. All dimensions are approximate and have not been verified by the selling party and cannot be verified by Sotheby’s International Realty Affiliates LLC. It is recommended that you hire a professional in the business of determining dimensions, such as an appraiser, architect or civil engineer, to determine such information. Sotheby’s International Realty ® and the Sotheby’s International Realty Logo are service marks licensed to Sotheby’s International Realty Affiliates LLC and used with permission.